Analytics Advantage: Shooting Percentage, Expected Goals, and Over/Underperformance
Stas Pupkov
2024-02-29
In fantasy hockey, player evaluation increasingly relies on a blend of traditional and advanced metrics. Among these, Shooting Percentage (SH%) and Individual Expected Goals (ixG) stand out for their ability to provide a deeper understanding of player performance. SH% measures the efficiency of converting shots into goals, while ixG estimates the number of goals a player should have scored based on the quality of their shots. This article explores the relationship between SH% and ixG, offering insights into identifying players who may be undervalued or overvalued in fantasy leagues. Through a methodical analysis, we aim to enhance drafting strategies by highlighting the potential impact of these metrics on player valuation.
Understanding the Metrics
In the landscape of fantasy hockey analytics, two metrics have emerged as critical tools for evaluating player performance: Shooting Percentage (SH%) and Individual Expected Goals (ixG). SH% is calculated by dividing the number of goals scored by the number of shots taken, offering insight into a player’s scoring efficiency. A higher SH% indicates a player is more effective at converting shots into goals, a valuable trait in fantasy hockey.
On the other hand, ixG is a predictive metric that quantifies the quality of shots based on factors like shot location, angle, and type, estimating how many goals a player should have scored. Unlike SH%, which looks at outcomes, ixG focuses on the process, providing a measure of whether a player’s goal tally is sustainable or likely to increase or decrease.
Analyzing SH% in conjunction with ixG reveals deeper insights. For instance, a player with a high SH% but low ixG may be overperforming, benefiting from luck rather than skill, suggesting potential regression. Conversely, a player with a low SH% but high ixG could be due for a breakout, as they are creating quality chances but have been unlucky in finishing.
By integrating both metrics into player evaluation, fantasy managers can gain a more nuanced understanding of a player’s true value, beyond what traditional statistics can offer.
Methodology
This analysis employs a data-driven approach to dissect the implications of SH% and ixG on player evaluation in fantasy hockey. Initially, data encompassing player performances, including goals, shots, and corresponding game statistics, were compiled from reputable hockey analytics sources. The study focuses on players with a minimum of 15 games played to ensure a robust data set. SH% was directly calculated from available data, whereas ixG was derived through models estimating goals based on shot quality and circumstances. The heart of this analysis lies in standardizing these metrics (using z-scores) to compare players on a uniform scale, thereby facilitating an objective assessment of their performance relative to league averages.
Analytical Insights
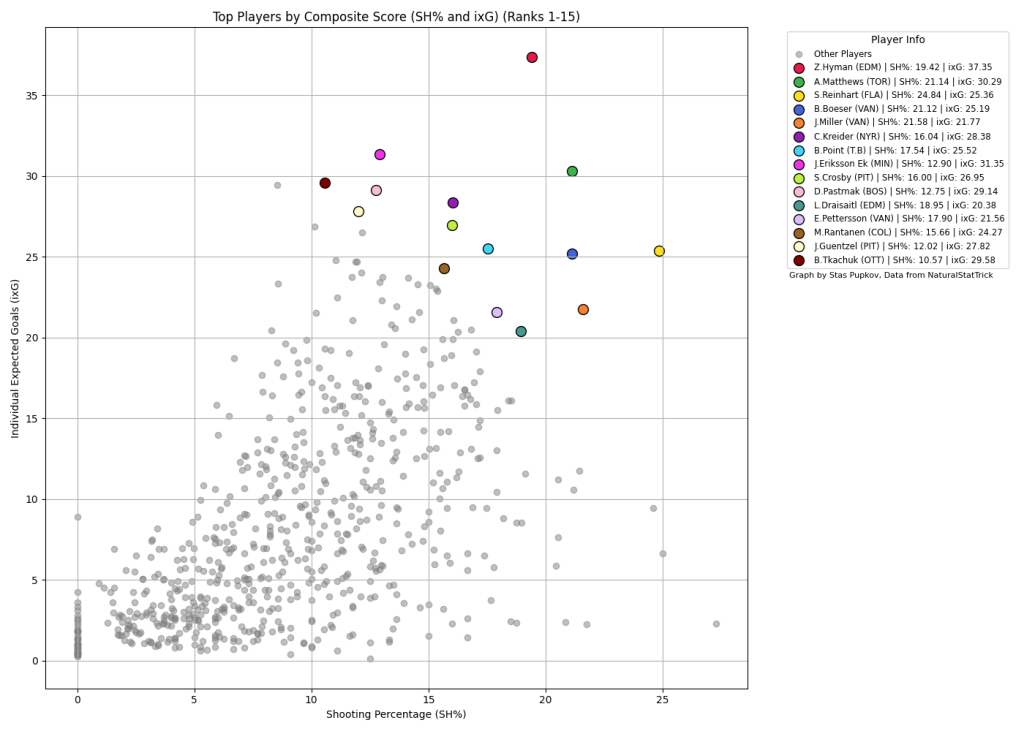
This section delves into the data-driven findings from comparing SH% and ixG for NHL players, aiming to uncover insights that could inform fantasy hockey decision-making. The analysis categorizes players into three groups based on their composite scores, which combine standardized values of SH% and ixG to rank overall performance.
Elite Performers (Ranks 1-15): This group showcases players whose scoring efficiency and expected goals align, indicating they are likely to maintain or even improve their performance. These players are typically well-recognized in fantasy leagues for their consistent contributions.
Middle Pack (Ranks 16-30): Players in this category have discrepancies between their SH% and ixG, suggesting potential for adjustment. Some may have high ixG but lower SH%, indicating they’re generating quality shots that haven’t translated into goals as expected—potentially undervalued players in fantasy drafts.

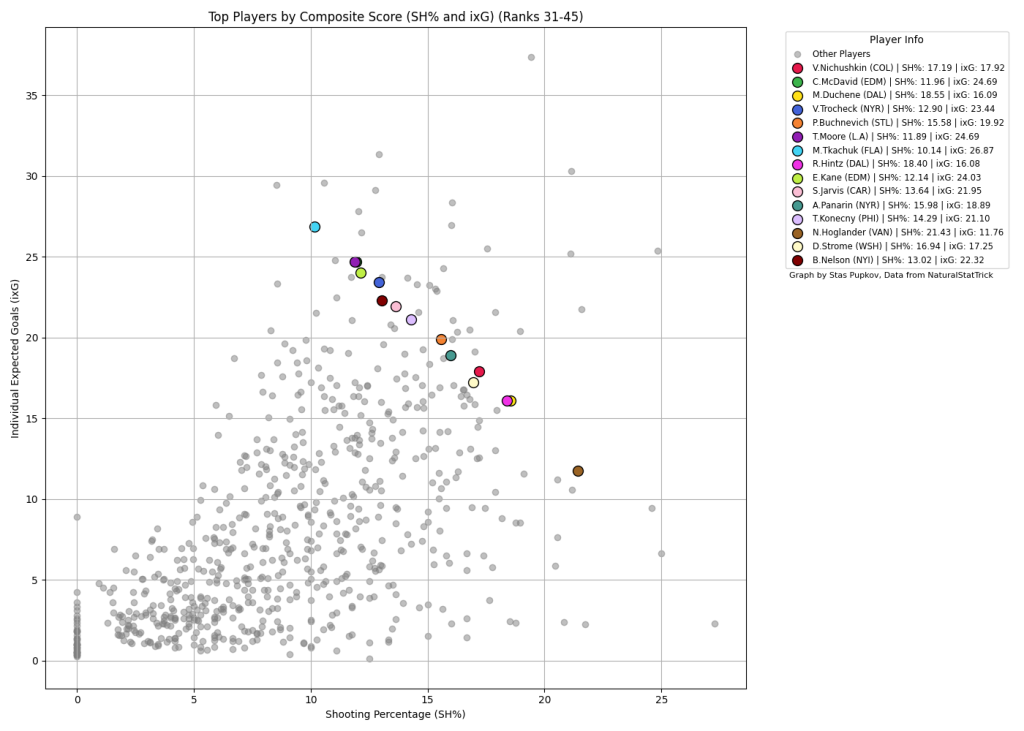
Hidden Gems (Ranks 31-45): This segment highlights players with strong ixG metrics that suggest they’re creating valuable scoring opportunities, despite a lower SH%. These individuals might be overlooked in fantasy drafts but have the potential to outperform their current valuation.
By examining players through the lens of SH% and ixG, fantasy managers can identify those with the potential to exceed expectations or those who might not sustain their current production levels.
In this comprehensive analysis of SH% and ixG across NHL players, we’ve uncovered patterns that challenge traditional fantasy hockey valuation methods. By integrating advanced metrics into player evaluation, fantasy managers can gain a nuanced understanding of player performance and potential. This approach not only highlights established stars but also reveals undervalued players poised for breakout seasons and overvalued players who may not sustain their performance. As the fantasy hockey landscape becomes increasingly competitive, leveraging insights from SH% and ixG analysis will be crucial for drafting a winning team.
Thank you for reading and have a great rest of your day!
Twitter/X – @DH_staspup for any questions, corrections, or comments
If you want to see how your team looks on the graph, DM me a list/photo of your roster
Player Data sourced from NaturalStatTrick
Related Posts
UPCOMING GAMES
| Apr 27 - 14:04 |
| vs |
| |
| Apr 27 - 17:04 |
| vs |
| |
| Apr 27 - 20:04 |
| vs |
| |
| Apr 27 - 22:04 |
| vs |
| |
Starting Goalies
Top Skater Views
Top Goalie Profile Views
LINE COMBOS
| Frequency |
| |
|---|---|---|
| 24.4 | TREVOR MOORE PHILLIP DANAULT VIKTOR ARVIDSSON | |
| 16.7 | ANZE KOPITAR ADRIAN KEMPE QUINTON BYFIELD | |
| 15.4 | ALEX LAFERRIERE KEVIN FIALA PIERRE-LUC DUBOIS | |
DobberHockey Podcasts

Fantasy Hockey Life: Salary Cap Basics Remix
If you missed last year’s series on salary leagues, this is a remix with some bonus material. Jesse and Victor discuss the different ways you can step up your dynasty league with a salary component. Our show is part of the Dobber Podcast Network and sponsored by Fantrax.com. Email [email protected] and ask to join our […]

Keeping Karlsson: No. 533 – Ultimate Champion Interview + Playoff Preview
On this week’s Keeping Karlsson Fantasy Hockey Podcast mega-show, Elan and Brian gather and analyze the latest fantasy hockey news, notes and data.
Fantasy Hockey Life: Tim-Eh’s Time in the TIDY Top Tier
When one of the managers in the TIDY league top tier left midseason, Patron Tim volunteered to give up his excellent team to take over a mid-season orphan fighting to escape relegation. And Tim did not go quietly. Ryan, Jesse and Victor welcome Tim to talk through his experience and the trades he made in […]
Keeping Karlsson: Better Off Nedeljkovic
On this week’s Keeping Karlsson Fantasy Hockey Podcast mega-show, Elan and Brian gather and analyze the latest fantasy hockey news, notes and data from the past season to work on projecting the 2023-24 NHL and fantasy hockey season. — Join the Keeping Karlsson patron community! Patrons get guaranteed KKUPL invitations, plus monthly bonus AMA episodes, and full access to […]
Fantasy Hockey Life: FHL Player Cards with Brandon
Our guy Brandon has been doing great work behind the scenes to great Fantasy Hockey Life prospect player cards, visualizations with the metrics we care about most – including BASH. These are a great tool to catch at a glance the stats for upcoming players. Jesse interviews Brandon and Victor on the decisions behind what […]