Analytics Advantage: Defensive Contributions and Fantasy Impact
Stas Pupkov
2024-03-29
In the fast-paced world of hockey, where goals light up the scoreboard and electrify crowds, the subtler aspects of the game often escape the spotlight. Among these, a player's defensive contributions, though less heralded, are pivotal in shaping the outcome of games. This is where advanced metrics like Expected Goals Against per 60 minutes (xGA/60) and On-Ice Save Percentage (oiSV%) come into play, offering a deeper, more nuanced understanding of a player’s defensive efficacy. xGA/60 provides an insight into the quality of chances a player allows on the ice, reflecting their ability to limit prime scoring opportunities. oiSV%, meanwhile, assesses the goaltending performance with specific players on the ice, indirectly capturing their influence on the team's defensive posture. For fans and analysts alike, these metrics open a window into the strategic underpinnings of hockey, revealing the often-unseen impact of skaters in securing the fort. This article aims to bridge the gap between casual observation and advanced analysis, shedding light on the critical, if understated, role of defensive play in hockey's complex ecosystem.
Data Overview
To unpack the defensive contributions of NHL skaters, our analysis hinges on two pivotal metrics: Expected Goals Against per 60 minutes (xGA/60) and On-Ice Save Percentage (oiSV%). These metrics are derived from comprehensive player and game data spanning recent NHL seasons, ensuring a blend of current relevance and historical context.
xGA/60 is calculated from shot attempt data, factoring in the shot type, distance, and angle to estimate the quality of scoring chances a player faces while on the ice. This metric serves as a proxy for defensive workload and effectiveness, highlighting players who excel in suppressing high-danger opportunities.
oiSV%, contrasting yet complementary to xGA/60, reflects the save percentage by goaltenders when a specific player is on the ice. While influenced by numerous factors, a higher oiSV% while a player is deployed suggests a positive defensive impact, contributing to successful shot suppression and goaltending support.
Our dataset encompasses skaters with a minimum threshold of ice time and games played, ensuring the analysis captures those with a significant role and impact on their teams. By employing advanced statistical models and normalization techniques, such as z-scores, we level the playing field across varying team strategies and league-wide defensive trends, allowing for an apples-to-apples comparison of skater performance.
Methodology
Our exploration into the defensive nuances of NHL skaters via xGA/60 and oiSV% involves a multi-step process, meticulously designed to ensure accuracy and comparability across the league:
Selection Criteria: The focus of our study is on skaters who have not only demonstrated a consistent presence on the ice but also have been instrumental to their teams’ defensive efforts. This is operationalized by including players who have participated in at least 40 games in a season, ensuring a substantial sample size for analysis. Furthermore, a minimum of 500 minutes of total ice time across the considered seasons guarantees we’re evaluating sustained performance rather than sporadic appearances.
Data Normalization and Statistical Analysis: To account for variations in team play styles, defensive systems, and league-wide trends, we normalize our key metrics, xGA/60 and oiSV%, using z-scores. This standardization process allows us to rank players on a uniform scale, identifying outliers and exceptional performances that transcend team contexts. Z-scores highlight players whose defensive capabilities are significantly above or below the league average, offering a clear lens through which to assess individual contributions.
Comparative Analysis: By juxtaposing xGA/60 and oiSV% side by side, we draw insights into how well players perform in limiting high-quality shots against and their impact on goaltending performance, respectively. This comparison reveals players who excel in both metrics, indicating a robust defensive game, as well as those who may excel in one area while being average or below in another, suggesting specialized defensive roles or areas for improvement.
Analyzing Player Defensive Performance: The Interplay of xGA/60 and oiSV%
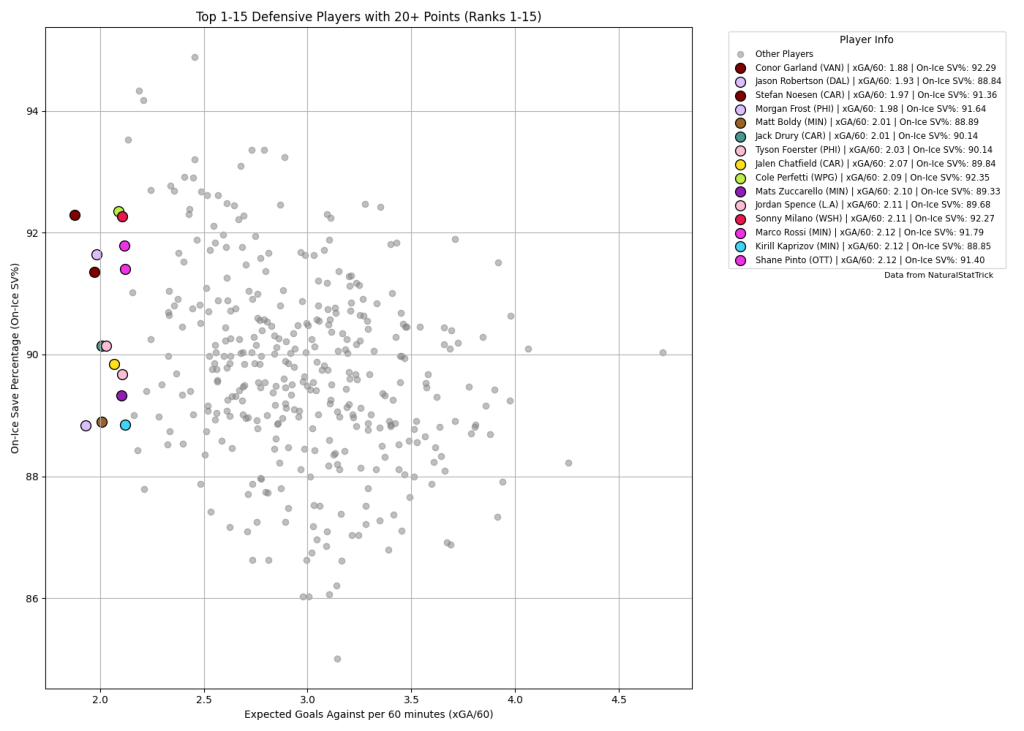
In our exploration of defensive analytics, we scrutinize xGA/60 and oiSV%, metrics that transcend the traditional scoreboard and shine a light on the defensive diligence of NHL players. They are not just reflective of personal skill but also indicative of the broader team defense. Our visual analysis slices through the data to reveal:
Top Performers: In this bracket, players exhibit not only exceptional individual defensive skills but also benefit from playing within cohesive defensive systems. Their impressive xGA/60 and oiSV% are testimonials to both their own competencies and their team's defensive prowess.
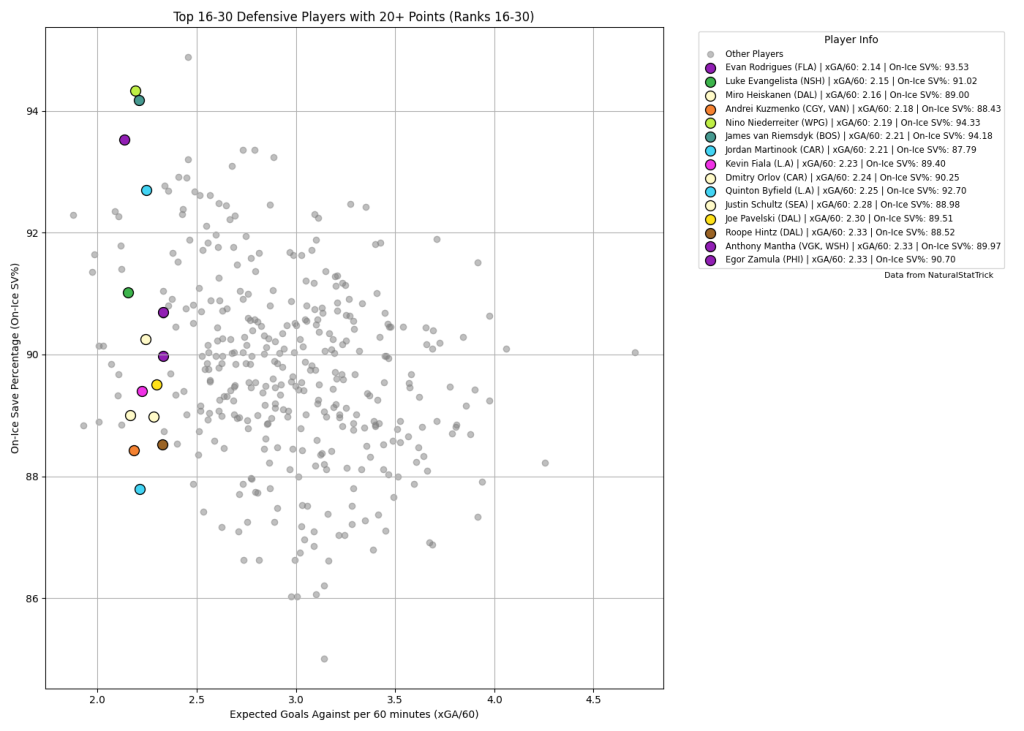
Mid-tier Enforcers: Players here demonstrate a mix of defensive talent and learning curves. Their metrics provide insights into their defensive roles and hint at the influence of team performance. The graph for this group narrates a story of players who bolster their team’s defense while still honing their craft.
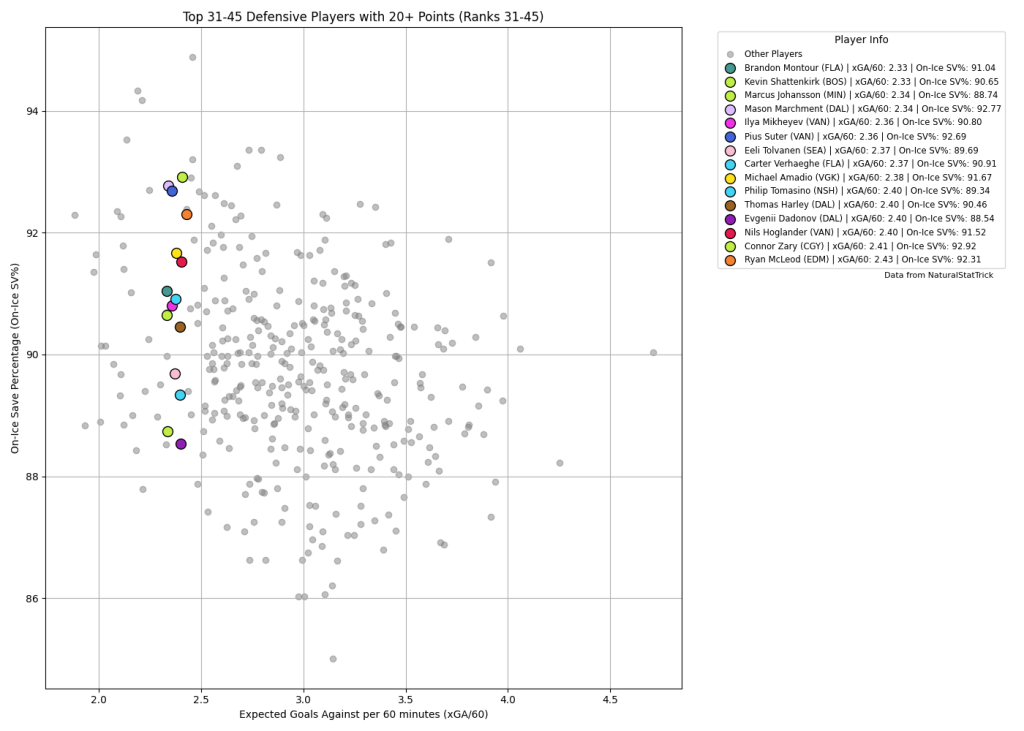
Developmental Talents: This group embodies potential in development, with players whose xGA/60 and oiSV% reflect both their individual learning processes and the varying strengths of their team’s defense. The graph underscores the importance of team systems in shaping a player's defensive statistics and the ongoing journey of skill refinement.
In every chart, we see not just individual defensive journeys but also how intricately a player’s performance is woven into the fabric of team defense. It is this interplay that our analysis aims to elucidate, providing a comprehensive view that informs fans, analysts, and fantasy leagues alike.
Conclusion
Our journey through the defensive landscapes of the NHL, guided by xGA/60 and oiSV%, has revealed the intricate balance between individual performance and team dynamics. These metrics illuminate the contributions of players often overshadowed by the flashier elements of the game, affirming the adage that defense is just as crucial as offense.
This analysis not only provides a deeper understanding of each player’s role but also enhances the way fans and analysts perceive the game. As we continue to refine these insights, they become invaluable tools for those strategizing in fantasy leagues and beyond.
***
Thank you for reading and have a great rest of your day!
Twitter/X – @DH_staspup for any questions, corrections, or comments
If you want to see how your team looks on the graph, DM me a list/photo of your roster
Player Data sourced from NaturalStatTrick
Related Posts
UPCOMING GAMES
| Apr 27 - 14:04 |
| vs |
| |
| Apr 27 - 17:04 |
| vs |
| |
| Apr 27 - 20:04 |
| vs |
| |
| Apr 27 - 22:04 |
| vs |
| |
Starting Goalies
Top Skater Views
Top Goalie Profile Views
LINE COMBOS
| Frequency |
| |
|---|---|---|
| 24.0 | GABRIEL VILARDI MARK SCHEIFELE KYLE CONNOR | |
| 17.7 | NINO NIEDERREITER ADAM LOWRY MASON APPLETON | |
| 16.3 | TYLER TOFFOLI SEAN MONAHAN NIKOLAJ EHLERS | |
DobberHockey Podcasts

Fantasy Hockey Life: Salary Cap Basics Remix
If you missed last year’s series on salary leagues, this is a remix with some bonus material. Jesse and Victor discuss the different ways you can step up your dynasty league with a salary component. Our show is part of the Dobber Podcast Network and sponsored by Fantrax.com. Email [email protected] and ask to join our […]

Keeping Karlsson: No. 533 – Ultimate Champion Interview + Playoff Preview
On this week’s Keeping Karlsson Fantasy Hockey Podcast mega-show, Elan and Brian gather and analyze the latest fantasy hockey news, notes and data.
Fantasy Hockey Life: Tim-Eh’s Time in the TIDY Top Tier
When one of the managers in the TIDY league top tier left midseason, Patron Tim volunteered to give up his excellent team to take over a mid-season orphan fighting to escape relegation. And Tim did not go quietly. Ryan, Jesse and Victor welcome Tim to talk through his experience and the trades he made in […]
Keeping Karlsson: Better Off Nedeljkovic
On this week’s Keeping Karlsson Fantasy Hockey Podcast mega-show, Elan and Brian gather and analyze the latest fantasy hockey news, notes and data from the past season to work on projecting the 2023-24 NHL and fantasy hockey season. — Join the Keeping Karlsson patron community! Patrons get guaranteed KKUPL invitations, plus monthly bonus AMA episodes, and full access to […]
Fantasy Hockey Life: FHL Player Cards with Brandon
Our guy Brandon has been doing great work behind the scenes to great Fantasy Hockey Life prospect player cards, visualizations with the metrics we care about most – including BASH. These are a great tool to catch at a glance the stats for upcoming players. Jesse interviews Brandon and Victor on the decisions behind what […]