

Analytics Advantage: Shot and Goal Locations for Specialists Like Zach Hyman, Tyler Bertuzzi, Tage Thompson, Roman Josi, and More
Stas Pupkov
2025-08-21
Building on last week's MoneyPuck work, I tightened the visuals and focused them on location. The shot maps now use a Kernel Density Estimation (KDE) overlay to show where shot volume piles up, and the scatter layer marks every goal with a cleaner legend (game state + shot type). The range is the last three regular seasons (2022–2025), empty nets excluded, with the rink mirrored so the attacking net sits on the right for quick reading.
This week zeroes in on where goals are scored and who lives at the extremes-crease workers (tips and rebounds), point shooters (55+ feet), and sharp-angle finishers (≥60°). Leaderboards are paired with single-player maps, so the claims have receipts. Let's dive in.
*Numbers might be slightly off by a goal, the table vs plot uses different logic, and I somehow lose or gain a goal in place. Titles say 2022-2024, but they are for 2022-2025.*
League context
22,817 goals from 992 scorers; 23.0 goals per scorer on average.
Location split: 27.9% crease, 31.4% slot, 3.2% long range.
Average goal distance 21.7 ft matches what the maps show: most offense finishes in the middle, with specialists bending the edges, either on the paint or from the points.
Net-front scorers (Tips, Jams, Rebounds)
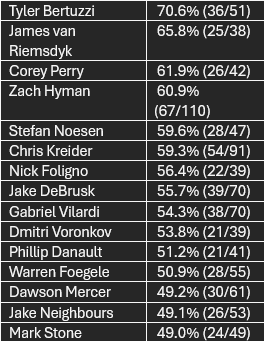
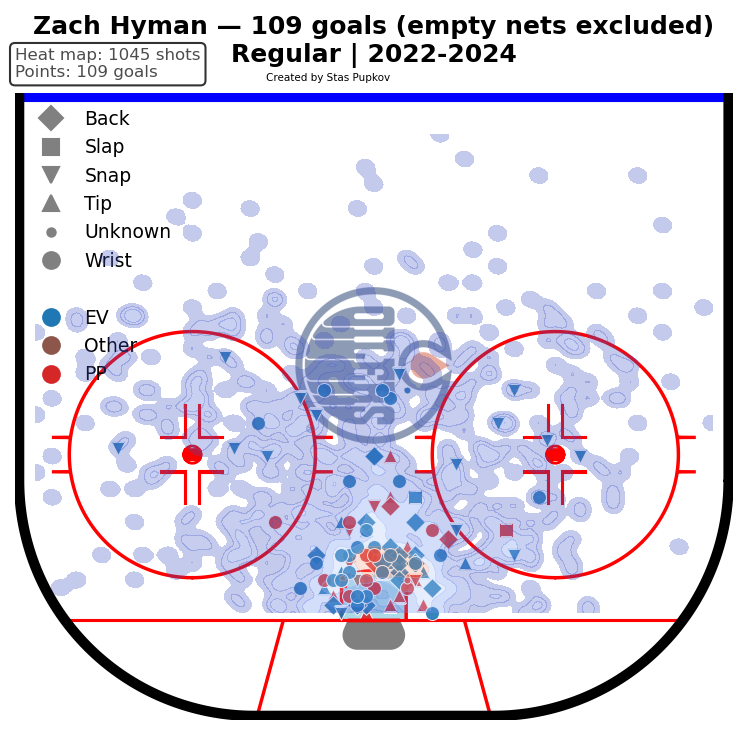
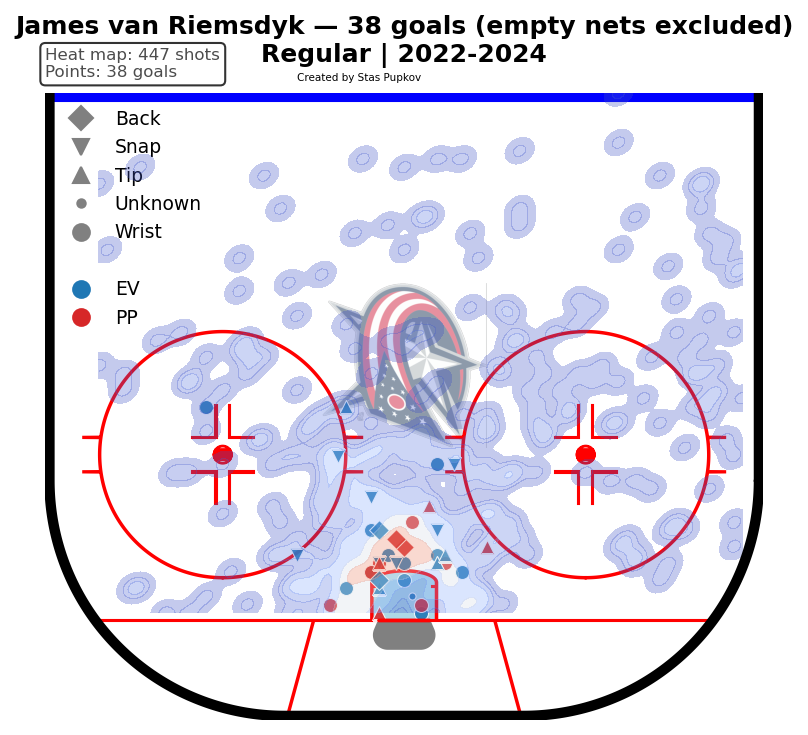
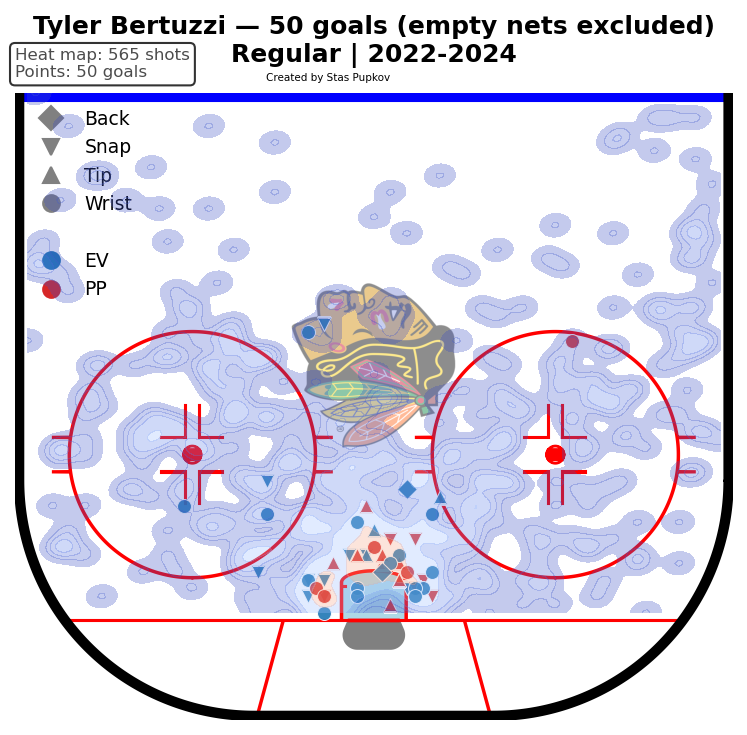
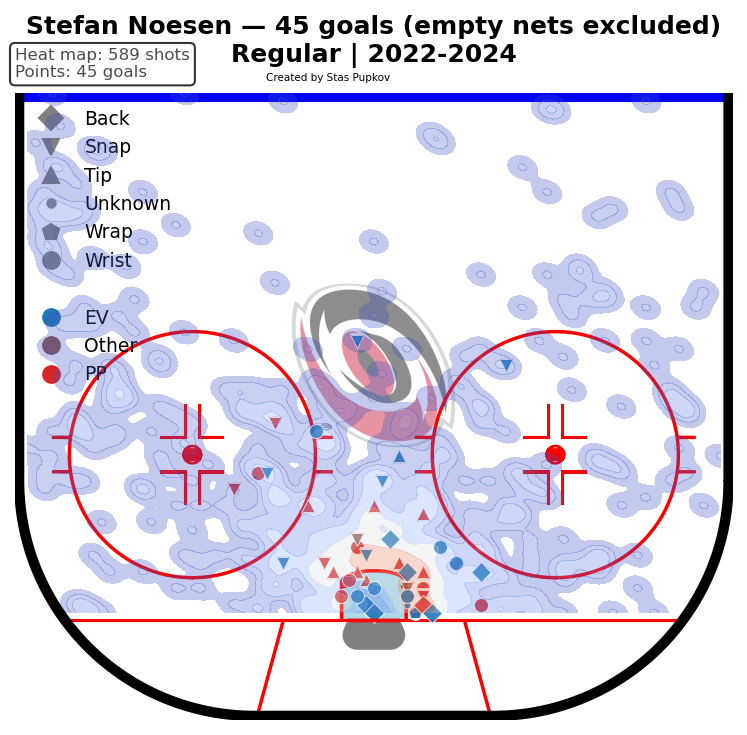
Start at the crease. The leaders on my tables all share the same fingerprint: goal markers packed inside ten feet and a KDE blob sitting on the goalie's lap. Zach Hyman is the clearest example-tons of tips and put-backs from the paint. James van Riemsdyk and Tyler Bertuzzi show nearly identical clusters, and Stefan Noesen, Garnet Hathaway, and Dakota Joshua aren't far behind. The common thread is timing and body position: seal eyes, win inside hands, touch pucks quickly instead of dusting them off.
Name – Percentage of Goals Scored in Close (Goals in close/Total goals)
Long-range scorers (All Positions, 30+ goals)
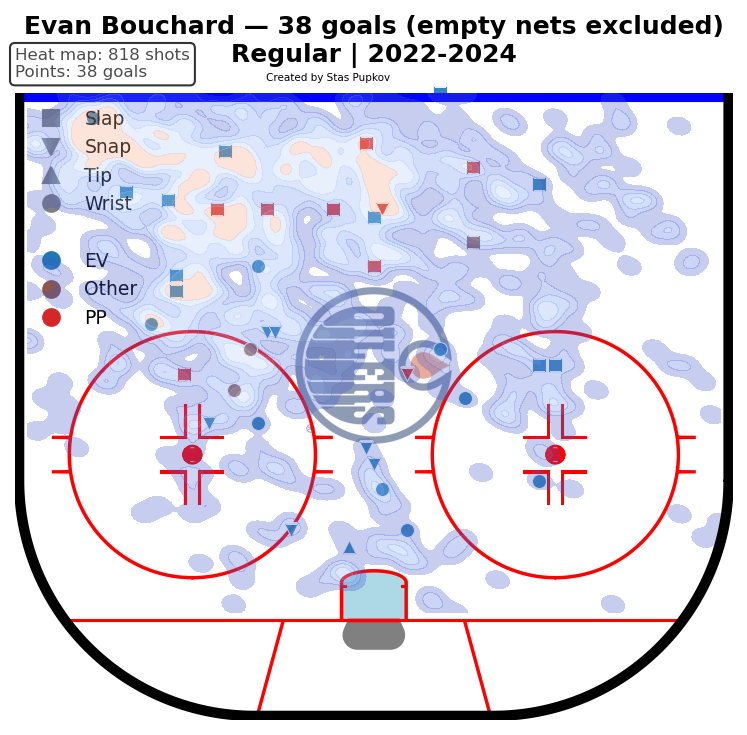
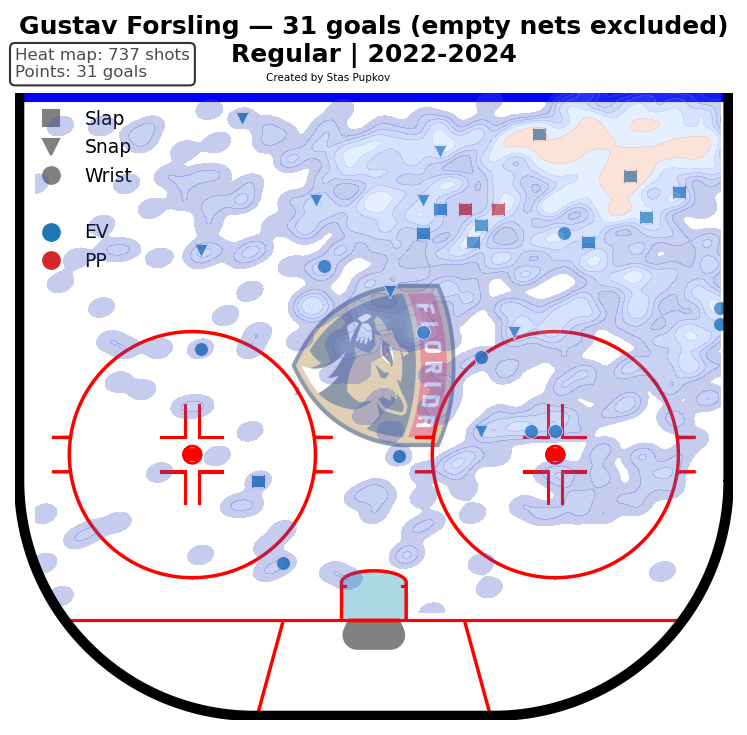
Long range makes up 3.2% of league goals, so specialists jump off the page:
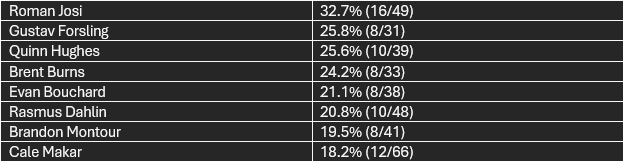
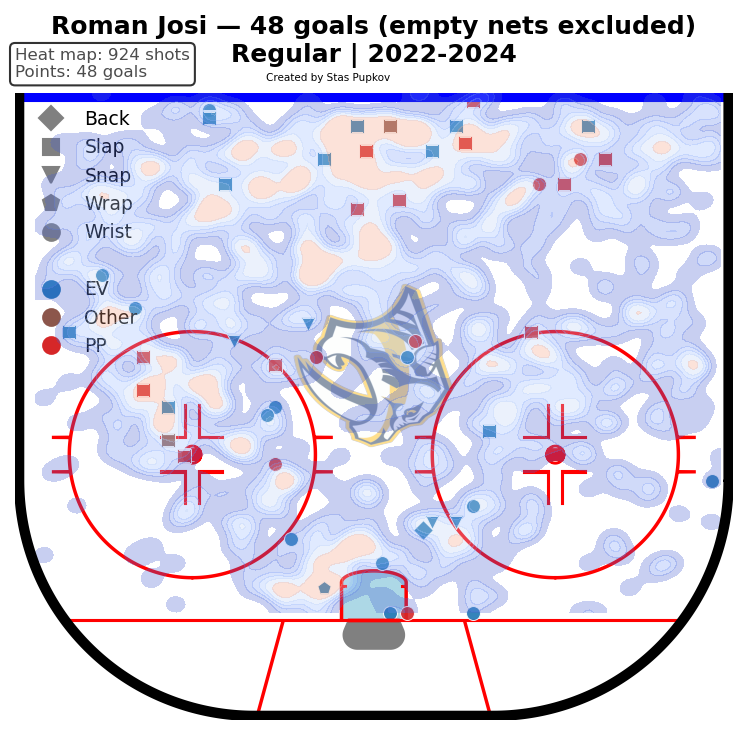
Their maps show lanes from the tops of the circles and blue line, with stacked traffic in front. That pattern (deception up top + layered screens) is the mechanism behind these percentages.
Versatility vs. specialization
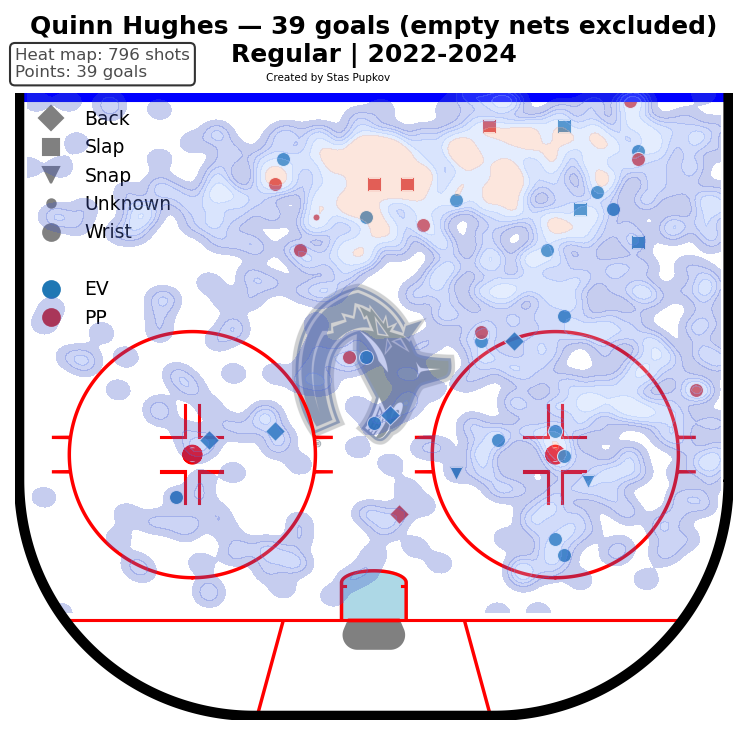
Your balance metric (even spread across distance bins) highlights multi-tool shooters:
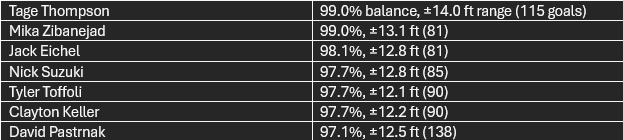
Their maps paint wide halos: inner slot, dots, and high slot all appear.
On the specialist side (50+ goals), the profiles are narrow by design:
Tyler Bertuzzi -62.0% balance; 70.6% net-front,
Zach Hyman -71.6%; 60.9%,
Jake DeBrusk -74.9%; 55.7%,
Chris Kreider -74.9%; 59.3%.
These are repeatable, set-play friendly shots in heavy traffic.
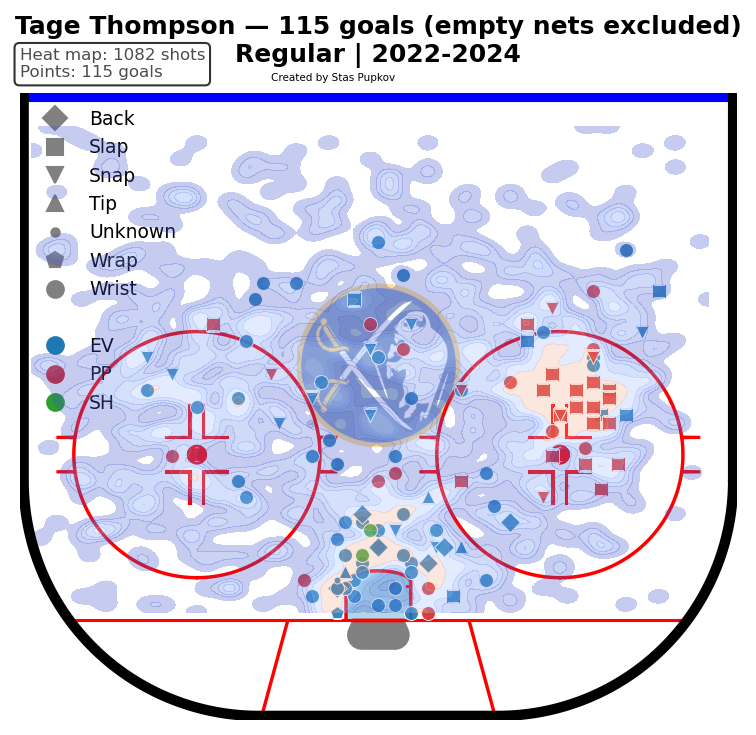
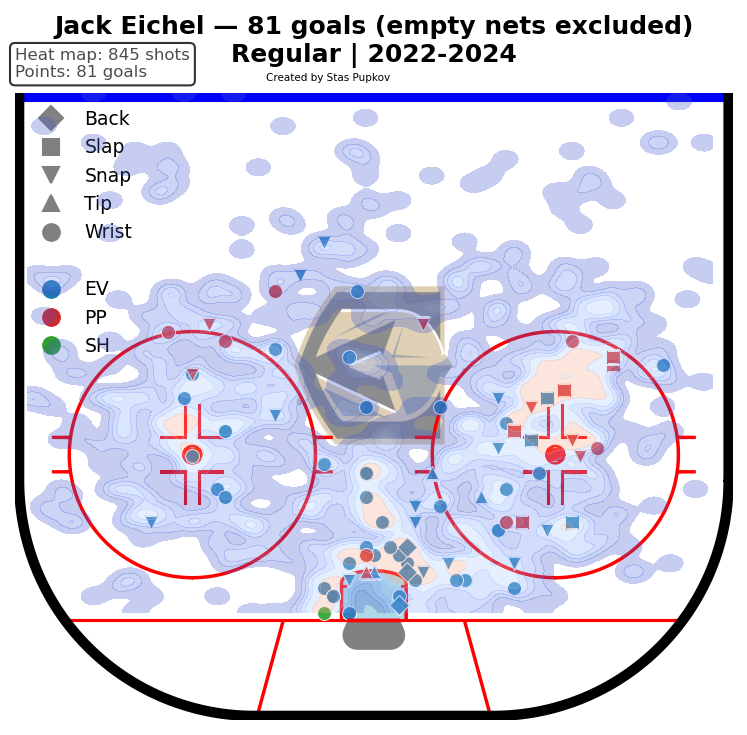
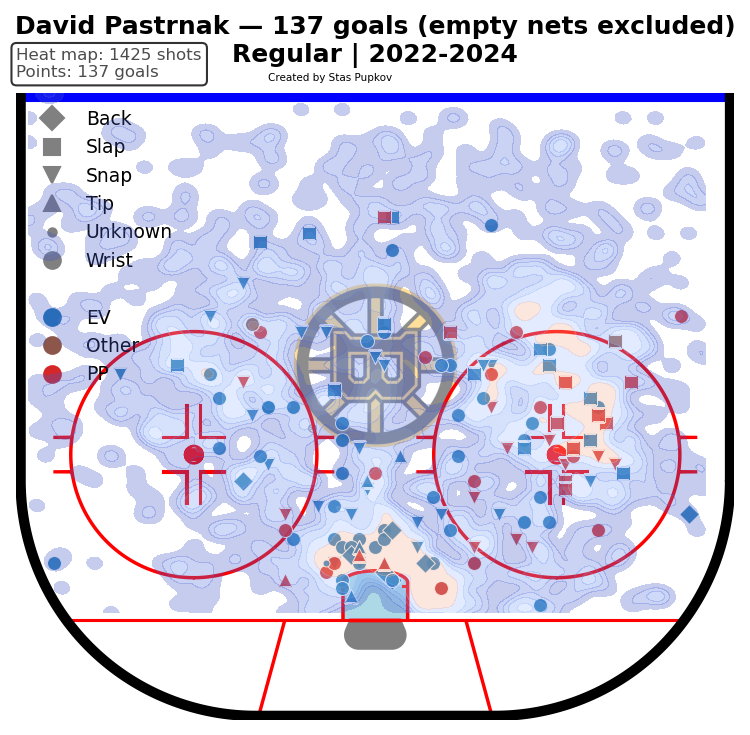
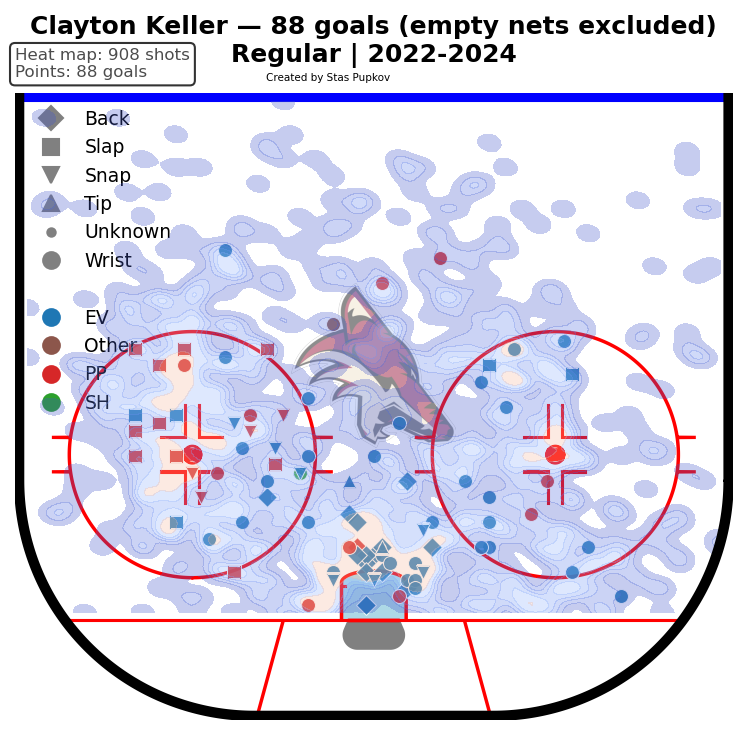
Across the last three regular seasons, the story holds: most goals finish in the middle of the ice, and separation comes from how shooters push to the edges. Net-front specialists cash in on tips, jams, and second touches through traffic. Point shooters use deception up high and layered screens. The balance group shows footprints everywhere, from the paint to the high slot. Because all player maps share the same mirroring and KDE settings, their profiles compare cleanly at a glance.
For role reads, the categories map to real usage. Net-front scorers fit units that funnel pucks low. Point shooters benefit from volume and a screen-first plan. Balanced scorers move across lines and game states without losing their shape. The table surfaces are the names; the maps are the receipts.
Related Posts
Starting Goalies













Top Skater Views
 VAN
 T.B
 CBJ
 SEA

Top Goalie Profile Views
| Players | Team | |
|---|---|---|
| JACOB FOWLER |
 MTL | |
| DEVIN COOLEY |
 CGY | |
| LOGAN THOMPSON |
 WSH | |
| JAKUB DOBES |
MTL | |
| TRISTAN JARRY |
 EDM | |
LINE COMBOS
| Frequency |
 S.J Players | |
|---|---|---|
| 24.7 | IVAR STENBERG COLLIN GRAF MACKLIN CELEBRINI | |
| 17.6 | WILL SMITH MICHAEL MISA MASON MARCHMENT | |
| 17.3 | TYLER TOFFOLI KIEFER SHERWOOD TY DELLANDREA | |
DobberHockey Podcasts

Keeping Karlsson: Down Across the Helle-ware
On this episode of the Keeping Karlsson Fantasy Hockey Podcast, Elan and Brian dissect the implications of the Connor Hellebuyck trade, injury returns in Carolina and Washington, hot streaks in Philadelphia and Seattle, crease contenders in Calgary and San Jose, a must-add in Tampa Bay and a sell-high in Colorado for your fantasy hockey league.

Fantasy Hockey Life: Ep 506 Prospects with Plenty to Prove II
Victor and Jesse return to talk about more fantasy hockey prospects in critical seasons. Covered are David Reinbacher, Cayden Lindstrom, Dalibor Dvorsky, Bradly Nadeau, Ilya Protas, Charlie Stramel, Otto Stenberg, Emil Hemming, Trey Augustine, Sebastian Cossa, Jacob Fowler, Easton Cowan, Matthew Wood, Gabe Perreault, and Victor Eklund. Thanks to Mason Black @NHLRankKing for his polls. […]
Keeping Karlsson: Matchup Maximizer 2026/27 Week 5
Jeremy takes a look at the schedule for the upcoming weeks of NHL action and recommends players with good schedules that you should consider streaming in to win your head to head matchups.
Keeping Karlsson: Short Shifts – Injuries, Outjuries, and Duds
Elan talks about all the latest injuries, outjuries, big performances and duds over a tight 20 minutes in this week’s episode of Short Shifts.
Keeping Karlsson: Never Tell Me the Podz
Elan and Brian do a wellness check on the Maple Leafs, lament Chicago and Buffalo snoozers, wonder whether and which Flyers have figured it out, and pick out the Capital standing out from the crowd.