

Analytics Advantage: Anatomy of a Breakout Fantasy Performance and Potential Breakouts to Target
Stas Pupkov
2026-07-24
Picture two skaters next to each other in your draft queue this September. Both scored at about a two-point-per-game fantasy clip last season; both are penciled into a top-six job this fall with a real shot at power-play time. One is 21, entering his second NHL season. The other is 26, entering his fifth.
The folklore treats them the same: wait for the third year. The data does not. The 21-year-old breaks out at somewhere between 13 and 18 percent, depending on his cell of the table; the 26-year-old at three to seven percent. The choice isn’t close, and the reason it isn’t close is the subject of this piece: breakouts run on a clock, and the clock starts at the birthday, not the debut.
Last week in this space we showed that team context is a tax paid almost entirely through plus/minus, and that role beats team tier everywhere else. This is the sequel: if role is what matters, when does the role — and the jump that comes with it — actually arrive?
THREE DEFINITIONS BEFORE WE START
A breakout is a jump of at least +0.75 fantasy points per game that lands at 2.25 or better, on a standard points build (3 per goal, 2 per assist, 0.4 per shot and block, 0.2 per hit). That is roughly +60 fantasy points over a season, landing at clearly startable output. Across 5,161 qualifying player-season pairs from 2008-09 through 2025-26, there were 353 of them: about one in fifteen.
A qualifying pair means back-to-back seasons with at least half a season played in each, and a debut inside our data window — so “career year two” means what it says.
The deployment delta is the change in a player’s minutes, overall and on the 5-on-4 power play, including a version measured over just his first 10 games. Hold that thought.
One robustness note up front: every result below was rerun across a three-by-three grid of gentler and harsher breakout definitions. The patterns survive everywhere, and get stronger as the bar gets stricter.
THE FOLKLORE AND THE CLOCK
Run breakout rates by career year and the folklore looks great: 11.4 percent in second seasons, 11.3 in third, then a cliff — 7.1 in year four, under five beyond. There it is, you might say: the Y2/Y3 window, just like the message boards promised.
Here is the part most breakout articles skip. Career year and age are nearly the same variable wearing different jerseys, and a marginal table cannot tell you which one is doing the work. So hold one fixed and wiggle the other, with a proper resampling test on top (cluster bootstrap by player, four hundred draws). At age 22-23, being in career year two or three rather than four-plus adds +0.5 percentage points, interval −3.5 to +4.4. Nothing. In career years two or three, being 23 or under rather than 26-plus adds +8.2 points, interval +4.1 to +12.4. Everything.
The corners of the joint table say it plainly: players 21 and younger break out at 17-18 percent in year two and year three alike; players 26 and older sit at three to seven percent no matter their service time. The third-year breakout is a real pattern with the wrong label on it. It was an under-23 breakout all along.
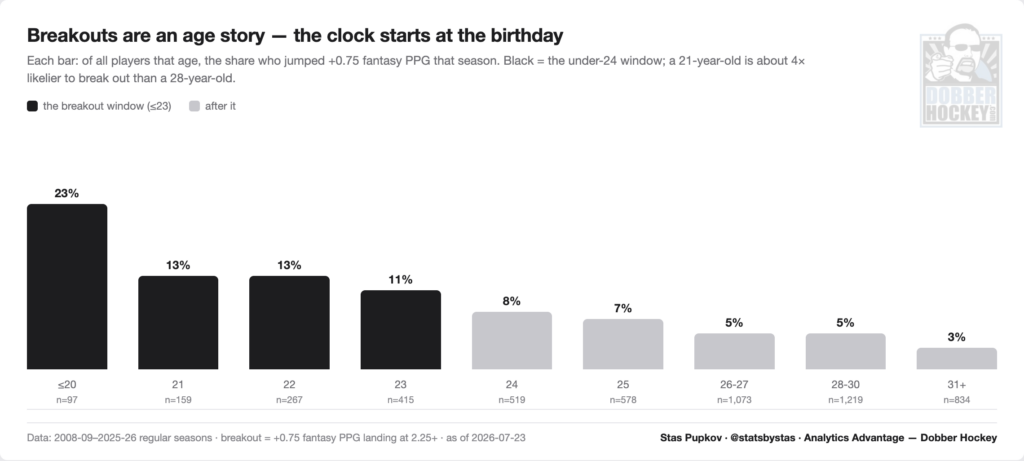
The age ladder in Figure 1 is brutally monotone, 23 percent at twenty or younger down to three percent past thirty. It rewrites two draft-day instincts. The “old sophomore” — the 25-year-old finally getting a full-time look — is a much worse bet than his career year suggests. And the young fourth-year player everyone quietly wrote off is still live, because his birthday says so, not his service time.
YOU CAN SEE IT BY GAME 10
What does a breakout look like while it is happening? In a word: minutes.
Breakout seasons arrived with +2.37 minutes of ice time per game; non-breakout seasons with −0.01. Fifty-five percent of breakouts came with two extra minutes or more, against a ten percent base rate. The power-play version is sharper still: 18.1 percent of breakouts added a full extra minute of 5-on-4 time, versus 2.2 percent of everyone else. Together, 57 percent of breakouts carried at least one of the two triggers, against under 12 percent of the field.
The minutes were not a mid-season reward, either. Among breakouts with a real ice-time jump, 74.7 percent already had the new minutes inside their first ten games. The job was handed out in October, in plain view of anyone checking time-on-ice columns instead of goals.
That is a screen you can run every October. A player showing +1.5 minutes over his first ten games broke out 17.6 percent of the time; a player without the bump, 4.3 percent. Four times the odds, visible weeks before the points arrive — exactly when your league-mates are still sorting by goals. Young players with the early bump: 22.6 percent.
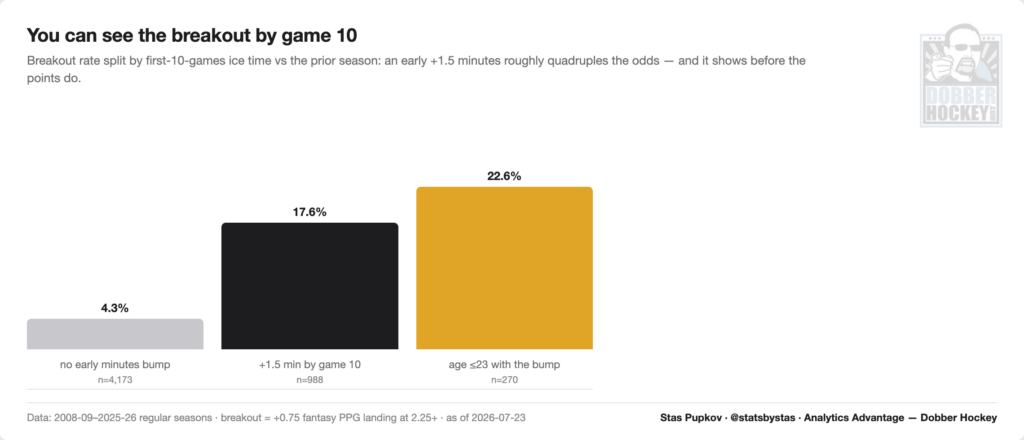
Two honest limits. Minutes and production co-arrive in October, so we cannot say the coach’s decision causes the jump rather than accompanies it — but the signal is on the ice by Game 10 either way, and the waiver claim plays the same. And about 43 percent of breakouts came with neither trigger: talent breaks out on its own schedule too. The screen multiplies odds; it does not gatekeep them.
THE JUMP IS (MOSTLY) THE NEW LEVEL
When a player breaks out, do you believe it? The median breakout kept 78 percent of its jump the following season, and 71 percent kept at least half. The age split is the actionable part: break out at 23 or younger and the median retention is 94 percent, with 85 percent holding at least half — a new permanent level with a rounding error. At 24-27 the median drops to 74 percent. At 28-plus it is 61.
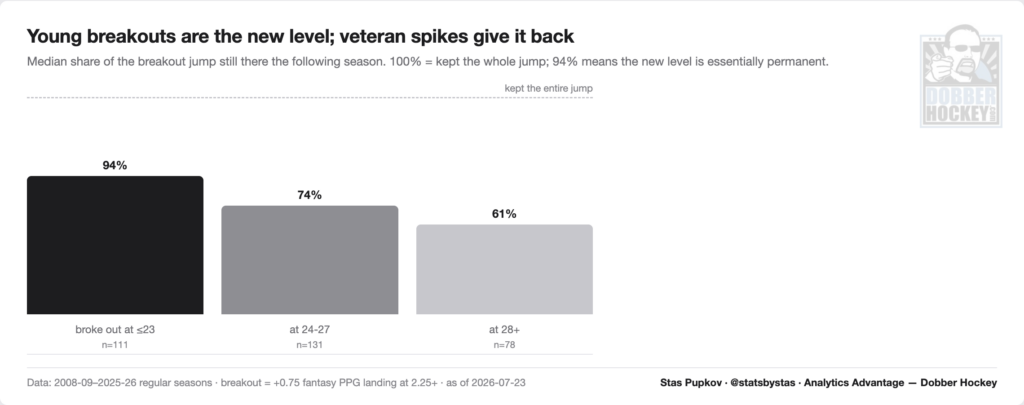
So pay full price for the young breakout at next year’s draft — the market’s instinct to discount one-hit wonders is wrong precisely where the wonder is young — and sell the 28-plus spike into its own hype. One caveat: last season’s 20 breakouts have no next season to measure yet; of the 333 that do, 96 percent logged a qualifying follow-up, and those 320 are the chart’s sample.
WHAT A BREAKOUT IS NOT
Last week’s column drew the map of where fantasy value comes from; the breakout data closes the loop on what it is not: the team.
Rank what explains a skater’s fantasy points per game and the ladder reads per-minute production 60 percent, power-play share of ice time 44, nightly minutes 37 — and team quality, half of one percent. (Each factor is measured on its own; they overlap heavily, which is why the shares don’t sum to 100.) It stays a rounding error inside careers, too: players who moved to stronger teams gained nothing (−0.22 fantasy points per game per full standings tier, interval −0.43 to +0.02).
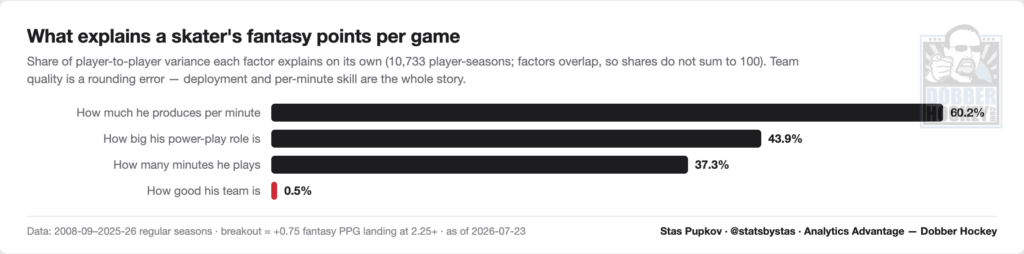
Breakouts, fittingly, tilt the other way: they happened on slightly weaker teams (.544 versus .560 preseason points percentage). Bad teams are where jobs open up. And the “bad-team PP1 monopoly” fails on the way out — the power-play share of scoring is flat across team strength (15 to 16 percent), and the top-two share of team PP points is flat too (31 to 33). Draft the player and his role; the logo is a plus/minus story.
THE 2026-27 BOARDS
Put the findings together — under-23, deployment pathway, October confirmation — and you get a preseason screen: skaters 23 or younger on October 1, entering career year two or three, with a visible route to new minutes (a top-six or top-four slot above last season’s usage, a projected PP1 job they didn’t hold, or double-digit vacated minutes at their position). Depth charts are July 21 projections; re-verify at camp.
Thirty-three names clear the screen; the 17 with the strongest pathways make the boards, and the 16 cuts are editorial, not statistical — mostly single-pathway depth cases. The two-board split is the point: a player already above the 2.25 startable line cannot “break out” by our own definition. He already arrived.
Each name carries P(Star) — the prospect model’s probability that his career peaks at star level, built from draft pedigree, pre-NHL trajectory, and league-equivalency scoring. Read it as a ceiling prior, not this season’s odds: the screen says who is positioned to jump now; P(Star) says how high the elevator ultimately goes. High ceiling plus pathway is a priority target; low ceiling plus pathway is a streamer.
Board A — the breakout board (below the line). Young players from this zone jump the full +0.75 at 13.6 percent, nearly triple the 4.9 for 26-and-older players at the same production level. (A production-zone cut; the hook’s 13-to-18 came from the age-by-experience table.) Expect one or two full breakouts of the ten; October tells you which.
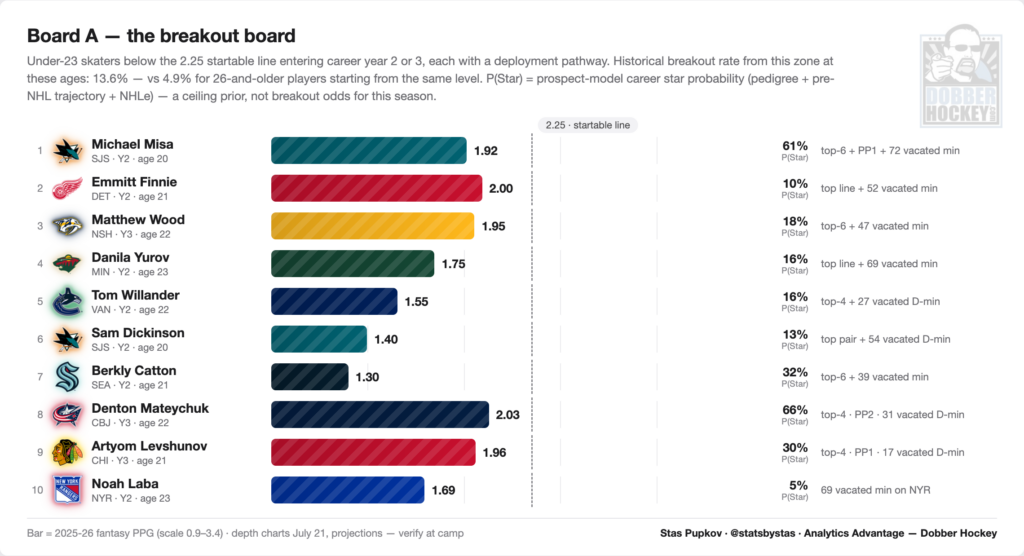
1. Michael Misa, SJS, 20, Y2 — 1.92 fPPG; top-six, projected PP1, 72 vacated minutes; P(Star) 61%. The full package.
2. Emmitt Finnie, DET, 21, Y2 — 2.00; top line, 52 vacated minutes; P(Star) 10% — stream the breakout, don’t keeper it.
3. Matthew Wood, NSH, 22, Y3 — 1.95; top-six, 47 vacated minutes; P(Star) 18%.
4. Danila Yurov, MIN, 23, Y2 — 1.75; top line, 69 vacated minutes; P(Star) 16%.
5. Tom Willander, VAN, 22, Y2 — 1.55; top-four, 27 vacated D-minutes; P(Star) 16%.
6. Sam Dickinson, SJS, 20, Y2 — 1.40; top pair at 20, 54 vacated D-minutes — the biggest blue-line vacuum on the board; P(Star) 13%.
7. Berkly Catton, SEA, 21, Y2 — 1.30; top-six, 39 vacated minutes; P(Star) 32%.
8. Denton Mateychuk, CBJ, 22, Y3 — 2.03; top-four, PP2 with a PP1 opening above him, 31 vacated D-minutes; P(Star) 66% — the quiet ceiling on this board.
9. Artyom Levshunov, CHI, 21, Y3 — 1.96; top-four with the PP1 job, 17 vacated D-minutes; P(Star) 30%.
10. Noah Laba, NYR, 23, Y2 — 1.69; 69 vacated minutes, the biggest forward-side vacuum; P(Star) 5% — the purest opportunity play here.
Board B — already arrived: the second-leap watch (at or above the line). Calling these breakout picks would be grading our own homework — they had the good season already. But young arrivals leap another +0.75 at 12.6 percent, take a +0.4 step 27 percent of the time, and hold startable value 87 percent of the time. Floor plus live ceiling.
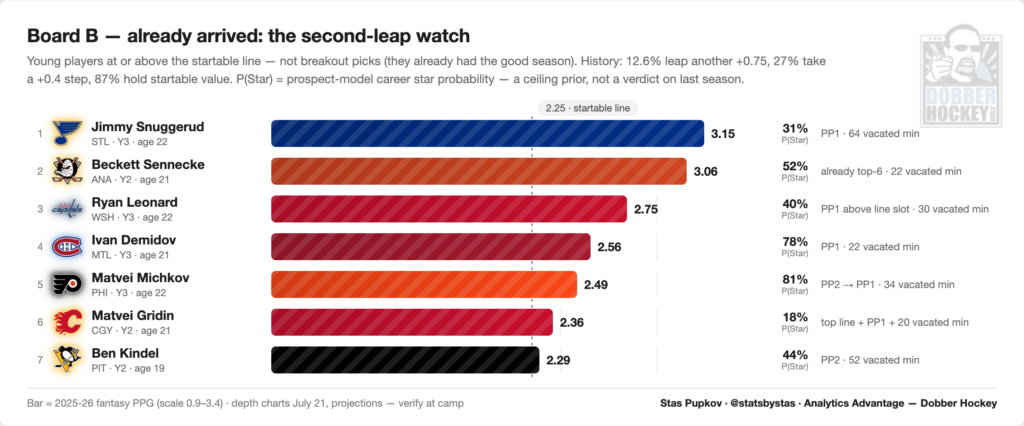
1. Jimmy Snuggerud, STL, 22, Y3 — 3.15; PP1, 64 vacated minutes; P(Star) 31%. Production says star, the pedigree prior isn’t sold — both can be true, which makes him a fascinating hold.
2. Beckett Sennecke, ANA, 21, Y2 — 3.06 as a rookie; already top-six, 22 vacated minutes; P(Star) 52%.
3. Ryan Leonard, WSH, 22, Y3 — 2.75; projected PP1 above his line slot, 30 vacated minutes; P(Star) 40%.
4. Ivan Demidov, MTL, 21, Y3 — 2.56; PP1, 22 vacated minutes; P(Star) 78%.
5. Matvei Michkov, PHI, 22, Y3 — 2.49; PP2-to-PP1 candidate, 34 vacated minutes; P(Star) 81%, the highest ceiling on either board.
6. Matvei Gridin, CGY, 21, Y2 — 2.36; all three pathways; P(Star) 18% — Snuggerud’s mirror image: maximum opportunity, modest ceiling.
7. Ben Kindel, PIT, 19, Y2 — 2.29 at nineteen; PP2, 52 vacated minutes; P(Star) 44% — exactly whom the age ladder says you pay up for.
Full disclosure: Demidov and Snuggerud get drafted on pedigree in every league regardless. Board A’s middle rows — the Woods, Mateychuks and Labas — are where this analysis earns its keep. And one omission on purpose: we did not print the model’s P(NHLer), because for players with 70 NHL games it answers a question that has already been answered.
THE PLAYBOOK
1. Draft the birthday, not the debut year. Under-23 is the window; “year three” is a coincidence of age. The old sophomore is a trap; the young veteran is not.
2. Rank candidates by pathway, not pedigree. A top-six or PP1 job the player didn’t hold last season is the trigger in most breakouts.
3. Run the ten-game check every October. An early +1.5 minutes quadruples breakout odds and shows before the points do. Act on minutes while your league sorts by goals.
4. Believe the young breakout. At 23 or under, 94 percent of the jump sticks — pay full price. Sell the 28-plus spike; it keeps 61.
5. Ignore the jersey for counting stats. Team quality explains half a percent of fantasy scoring, and breakouts tilt toward weaker teams, where jobs open up. Plus/minus is the one exception.
6. Respect the 43 percent. No usage jump does not mean no breakout. The screen raises your odds; talent keeps its own schedule.
**2008-09 through 2025-26 regular seasons, 5,161 qualifying player-season pairs. Breakout = +0.75 fantasy points per game landing at 2.25+, build G3/A2/SOG0.4/BLK0.4/HIT0.2. Depth charts as of July 21; verify at camp.**
Related Posts


Starting Goalies











Top Skater Views
 CGY
 T.B
 SEA
Top Goalie Profile Views
 MTL
 WPG
 CAR
 UTA


LINE COMBOS
| Frequency |
 EDM Players | |
|---|---|---|
| 28.4 | VASILY PODKOLZIN CONNOR MCDAVID LEON DRAISAITL | |
| 13.0 | RYAN NUGENT-HOPKINS KASPERI KAPANEN COLTON DACH | |
| 12.3 | OWEN MICHAELS MATHIEU JOSEPH ALEX FORMENTON | |
DobberHockey Podcasts

Keeping Karlsson: Down Across the Helle-ware
On this episode of the Keeping Karlsson Fantasy Hockey Podcast, Elan and Brian dissect the implications of the Connor Hellebuyck trade, injury returns in Carolina and Washington, hot streaks in Philadelphia and Seattle, crease contenders in Calgary and San Jose, a must-add in Tampa Bay and a sell-high in Colorado for your fantasy hockey league.

Fantasy Hockey Life: Ep 506 Prospects with Plenty to Prove II
Victor and Jesse return to talk about more fantasy hockey prospects in critical seasons. Covered are David Reinbacher, Cayden Lindstrom, Dalibor Dvorsky, Bradly Nadeau, Ilya Protas, Charlie Stramel, Otto Stenberg, Emil Hemming, Trey Augustine, Sebastian Cossa, Jacob Fowler, Easton Cowan, Matthew Wood, Gabe Perreault, and Victor Eklund. Thanks to Mason Black @NHLRankKing for his polls. […]
Keeping Karlsson: Matchup Maximizer 2026/27 Week 5
Jeremy takes a look at the schedule for the upcoming weeks of NHL action and recommends players with good schedules that you should consider streaming in to win your head to head matchups.
Keeping Karlsson: Short Shifts – Injuries, Outjuries, and Duds
Elan talks about all the latest injuries, outjuries, big performances and duds over a tight 20 minutes in this week’s episode of Short Shifts.
Keeping Karlsson: Never Tell Me the Podz
Elan and Brian do a wellness check on the Maple Leafs, lament Chicago and Buffalo snoozers, wonder whether and which Flyers have figured it out, and pick out the Capital standing out from the crowd.