

Analytics Advantage: Where Fantasy Value Actually Live
Stas Pupkov
2026-07-17
Two forwards finish a season with the same point total, the same shot volume, the same power-play time. One plays on a team that wins 60% of its games; the other plays on a team that was selling by American Thanksgiving. In most fantasy formats those are not the same player — and the entire difference between them flows through channels that have nothing to do with the skill you drafted them for. This column is about those channels: which parts of fantasy value belong to the player, which parts belong to the jersey, and which parts belong to the calendar. The previous two columns asked what “good” means across eras and how players age. This one asks the same kind of structural question about fantasy value itself, and the answers hold up across every season I can test, not just the last one.
The measuring sticks
Same rules as always: every unit gets defined before any result, and every constant is computed rather than assumed.
Fantasy points (points build). A generic points-league line: 3 per goal, 2 per assist, 1 per power-play point, 0.4 per shot, hit, and blocked shot, 0.2 per penalty minute. Nothing about this weighting is sacred — that’s part of the argument — but it approximates the mainstream points formats, and every claim below was also checked against a 9-category build.
The 9-category build. Standard roto categories (goals, assists, power-play points, shots, hits, blocks, penalty minutes, plus/minus, face-off wins), each converted to a z-score across all skaters with 20+ games, then summed. A player’s “9-cat value” is how many standard deviations of category production he adds.
Team tiers. Each team-season is labeled from its own final standings: the top six teams by points percentage are juggernauts, the bottom six are rebuilds, and the playoff cutline splits the middle into contenders and limbo. This is a descriptive proxy — it knows nothing about intent, cap space, or what a front office believes it’s doing. It just answers: was the jersey good?
Off-night share. The fraction of a team’s schedule played on Monday, Wednesday, Friday, and Sunday — the nights when few NHL teams play and a weekly-lineup manager has open slots to fill. A team’s off-night share is, mechanically, how often its players are startable without benching someone better.
The data. Official NHL season totals for every skater and goalie from 2015-16 through 2025-26 (validated against the league’s own feeds; power-play points matched exactly), the full 2025-26 game-by-game record, and the complete published schedules for 2025-26 and 2026-27. Rate claims use a 20-game minimum. Every team-context effect below is correlational accounting — which jersey a stat line wore — not a causal claim that a player got better or worse.
One category is doing almost all of the work
Here is the central fact. Take every skater’s nine category z-scores and ask, category by category, how much of the variance is explained by which team he plays for. For goals, assists, shots, hits, blocks — every category a player mostly earns himself — the team explains almost nothing: never more than 8% in any of the last eleven seasons. For plus/minus, the team explains between 30% and 53% every single season, averaging 40% (Fig. 1). The team-to-team spread runs 15 to 29 goals of rating per season. There is no second category like it; there isn’t even a distant cousin.
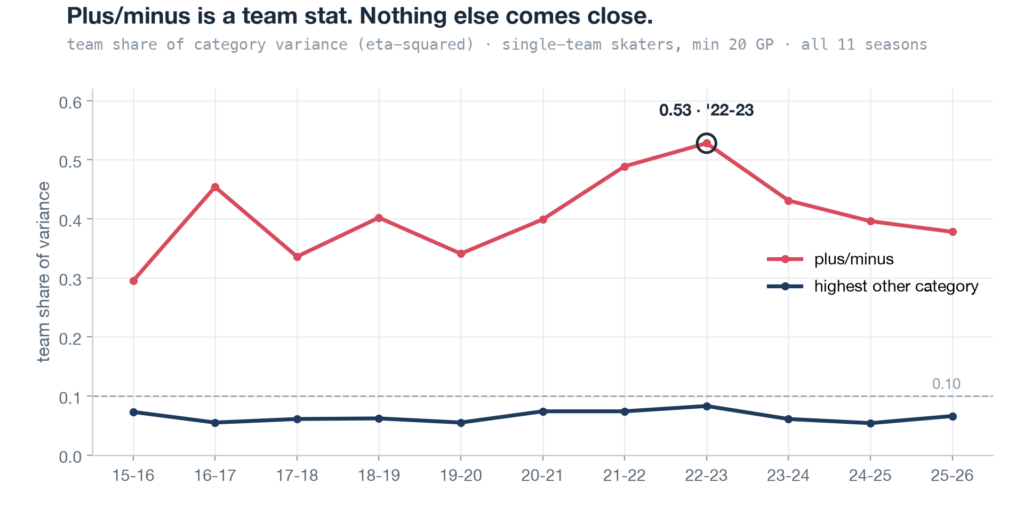
Figure 1. Share of category variance explained by team, per season. Plus/minus is alone in its own regime; no other category ever clears the dashed line.
The consequence for a category league is blunt: removing plus/minus from the 9-category build erases between 35% and 50% of the fantasy-value gap between skaters on the best teams and skaters on the worst — in every one of the last eleven seasons (average 43%; 45% in 2025-26). Roughly half of the “just draft players from good teams” instinct is one category — a category the player barely controls, that the trade deadline can reprice overnight, and that a commissioner could simply turn off. If your league counts plus/minus, you are running a hidden which-team-did-you-draft category. If it doesn’t, most of that team-quality edge never existed in the first place.
Formats are positional geometry
The second structural fact follows from the first. Rank every 2025-26 skater under the points build, then again under the 9-category build, and study who moves. The risers are overwhelmingly centers and defensemen; among the 20 players who gain the most rank, half are centers. The fallers are overwhelmingly wingers — 77% of the thirty biggest losers. The mechanism is not mysterious: face-off wins and plus/minus are currencies only a category league accepts, and they are earned disproportionately in the middle of the ice and on the blue line. A points league pays a winger for his point total and asks no further questions; a category league audits the whole line.
Concrete 2025-26 examples, offered as history rather than advice: J.J. Moser and Devon Toews — defensemen with modest point totals, big plus/minus and block numbers — each ranked roughly 160 spots higher in categories than in points. Jack Drury, then a fourth-line center winning 560 face-offs, gained 189 spots. In the other direction, Brock Boeser produced a top-160 point season that ranked 429th in categories, dragged underwater by a −48 rating on a struggling Vancouver team — the empty-calorie profile in one line. The same geometry extends to points leagues with different weights: score the league under a block-heavy, no-plus/minus points build (weights some reader leagues actually use) and the blue line rises exactly the way the era-value column said it should — the top defensemen climb into the top five overall, and pure shot-blockers gain 60–70 ranks. Your settings are not a neutral container. They are a positional thumb on the scale, and you should know which positions yours favors before you draft.
What else the jersey does — and doesn’t — touch
Role comes first — in every season on record here. Split forwards into top-six and depth by ice time and the cleanest test in this column falls out: a rebuild team’s top-line forwards out-produce a juggernaut’s middle-six forwards in all eleven seasons, and it is never close — roughly 3.5 fantasy points a game against 2.4 (Fig. 2). Team quality amplifies the players positioned to cash it in and barely moves a fourth line; the tier gap among top-six forwards runs about three times the gap among depth forwards. As a drafting principle: secure the role, then let the jersey break ties — never the reverse.
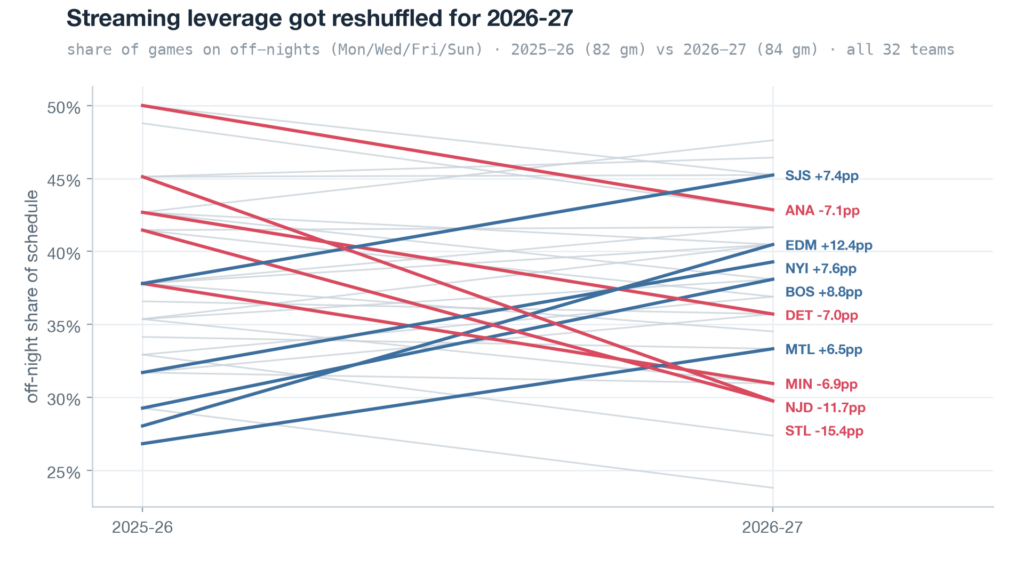
Figure 2. Mean fantasy points per game: top-line forwards on rebuild teams vs middle-six forwards on juggernauts, per season.
Physical categories ignore the standings. Hits-and-blocks value is uncorrelated with team tier (r = 0.05 in 2025-26). There is no bad-team discount on a shot-blocker — and, tested carefully, no systematic bad-team premium either. Banger value is individual, which makes it the one commodity you can shop for anywhere in the league without paying a context tax.
A goalie’s wins owe about as much to the jersey as to the goalie. Season by season, the share of win-total variance explained by the team’s tier is comparable to the share explained by the goalie’s own save percentage — tier comes out ahead in 5/11 seasons, save percentage in six, and neither ever dominates. An earlier draft of this column claimed the tier side wins outright; run over 11 seasons instead of one, that claim doesn’t hold, so it’s gone. What survives is stranger and more useful: the category most goalie formats weight heaviest is, at best, half about the player you drafted. Draft the situation with the same seriousness as the résumé.
Power-play production follows the standings — unlike hits and blocks. Team power-play points separate cleanly and persistently by tier (Fig. 3): juggernauts average around 165 over the panel, rebuilds around 110, and the ordering holds in 10/11 seasons. But the share of a team’s power-play production captured by its top producer is nearly flat across tiers (roughly 18–21% everywhere) — the first-unit role travels, the pie does not. A first-unit job on a rebuild is a fifth smaller in absolute terms than the same job on a juggernaut, which makes power-play opportunity the one peripheral that genuinely does follow team quality. Chase the role first, but here — unlike with the physical categories — the jersey is not a wash.
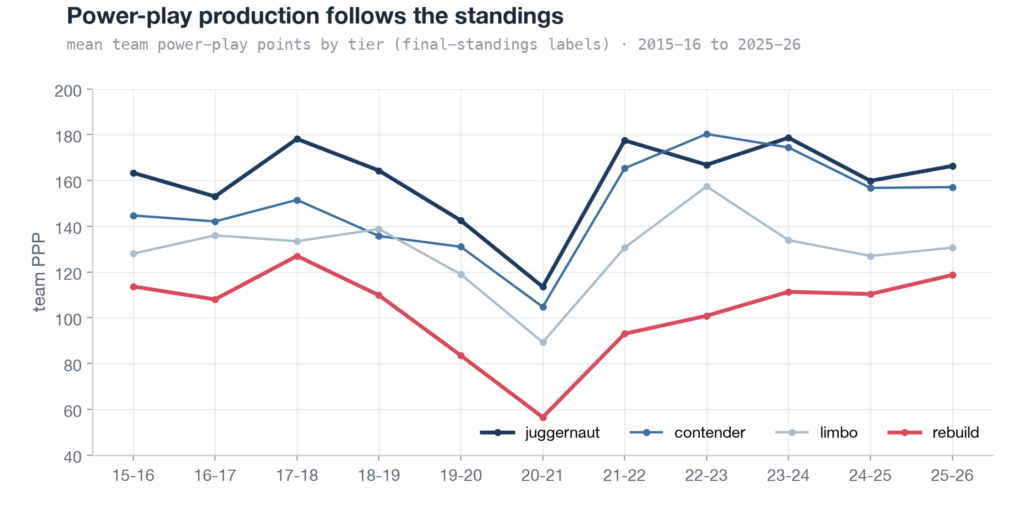
Figure 3. Mean team power-play points by standings tier, per season. The dip is the shortened 2020-21 schedule.
The calendar is the second axis
Production is only half of fantasy value in weekly formats; the other half is whether the games land on nights you can use. Weight each skater’s production by his team’s off-night share and the boards genuinely reorder: in 2025-26, 293 of 715 qualified skaters — over 40% — move past someone 10 or more ranks above them when usable production replaces raw production. And the league’s move to an 84-game schedule in 2026-27 (the first since 1993-94) reshuffled the leverage substantially (Fig. 4): Edmonton gains 12.4 percentage points of off-night share, the largest move in either direction; St. Louis loses 15.4%. A skater whose production doesn’t change at all can gain or lose a meaningful slice of his usable value purely because the schedule-maker moved his games. Two smaller calendar effects are real but modest, and honesty requires their actual sizes: home ice is worth about +3.1% in scoring, and Wednesdays run 2–3% hot (an earlier estimate of +6.7% was roughly double the truth and is retired).
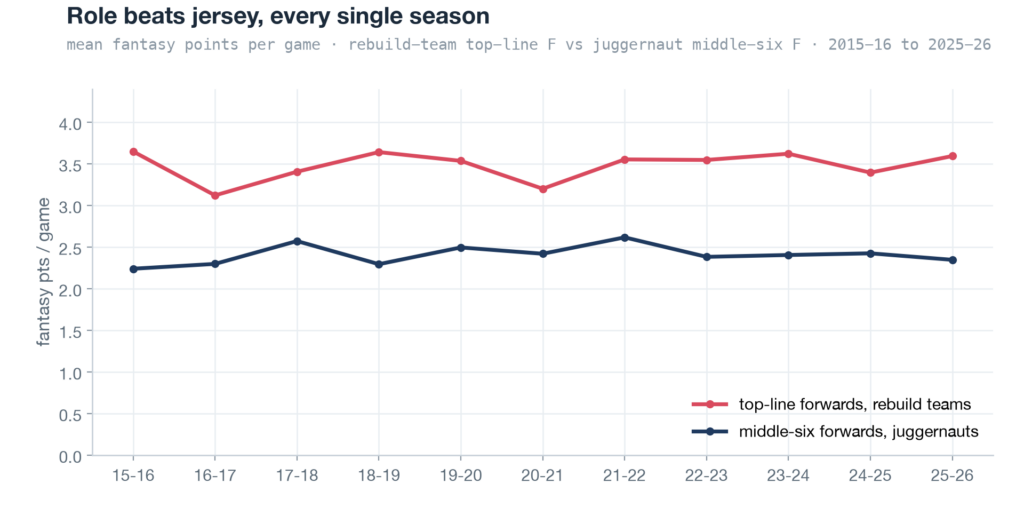
Figure 4. Off-night share of schedule, 2025-26 vs 2026-27, all 32 teams; moves over six percentage points highlighted.
One bridge to the aging series before closing: the tiers also sort by birthdate. Rebuild rosters are the youngest in the league (median skater age about 26.1 in 2025-26, against roughly 27.5 elsewhere), which means the players most exposed to the plus/minus tax and the smallest power-play pie are disproportionately the young ones your keeper league is asking you to be patient with. The aging column’s advice and this column’s advice compound: a young player on a rebuild carries both the age discount and the context tax, and both are priced facts rather than fates.
A myth for the road: the contract year
Since team context is this column’s subject, one adjacent myth deserves its number. Skaters entering the final year of their contracts in 2025-26 produced less than the field — about 0.65 fantasy points per game less — but the gap is deployment, not motivation: more depth players reach expiry than stars do. Normalize by ice time and contract-year players produce 96.5% identical value per minute. There is no walk-year bump to chase and no walk-year fade to dodge; there is only a roster-composition artifact wearing a narrative.
The playbook
— Know your format before your board. Plus/minus alone carries nearly half of the team-context edge; whether it’s counted changes who is valuable, not just by how much.
— In category leagues, buy the centers and puck-moving defensemen the points column underpays; in points leagues, discount the big point total that arrives with a bleeding rating.
— Draft goalie situations with the same seriousness as goalie résumés — the wins category is about half-jersey.
— Shop for hits and blocks anywhere — they never check the standings.
— Role beats tier in all eleven seasons tested; on the power play the role travels, but the pie follows the standings.
— In weekly formats, price the calendar: off-night share just moved by double digits for several teams, and it’s the rare edge printed a year in advance.
Team context, in the end, is a tax code: predictable, legible, and mostly paid through one line item. It is not destiny — the player in front of you can always beat the base rate — but you should at least know what you’re being charged.
Related Posts

Starting Goalies







Top Skater Views
 DET
DET STL
STL BOS
BOSTop Goalie Profile Views
 EDM
EDM NYR
NYR MTL
MTL S.J
S.J WSH
WSH


LINE COMBOS
| Frequency |
 CHI Players CHI Players
| |
|---|---|---|
| 21.2 | ROMAN KANTSEROV PATRICK KANE CONNOR BEDARD | |
| 18.7 | FRANK NAZAR OLIVER MOORE RYAN DONATO | |
| 18.6 | TEUVO TERAVAINEN ANTON FRONDELL TYLER BERTUZZI | |
DobberHockey Podcasts

Keeping Karlsson: Short Shifts – NHL Frozen Frenzy Recap
Elan and Lewis recap the Frozen Frenzy as well as two big returns and more!
Keeping Karlsson: Delusions of Garandeur
Elan and Brian dive into the latest NHL hot streaks, cold streaks, line changes, outjuries, injuries, buy-lows and sell-highs to give you top notch tips in your fantasy hockey league

Fantasy Hockey Life: TiDy Takes Part 2
Last week, Victor Nuno and Ryan Downey broke down trades from our top tier dynasty league. This week, they consider some dynasty trades from other divisions. Have a listen! Our show is part of the Dobber Podcast Network and sponsored by Fantrax.com. Email [email protected] and ask to join our free discord. Join our Patreon at […]
Keeping Karlsson: Matchup Maximizer 2026/27 Week 3
Elan takes a look at the schedule for the upcoming weeks of NHL action and recommends players with good schedules that you should consider streaming in to win your head to head matchups.
Keeping Karlsson: Short Shifts – Sharks Looked Like Celebweenies
Elan recaps the major injuries, outjuries, game results and changed line combos that we’ve seen since Sunday’s mega-show.