

Analytics Advantage: What the New Goaltending Trends Means for Goalie Fantasy Value
Stas Pupkov
2026-08-07
In last week’s Analytics Advantage, we covered how the 60-start workhorse goalie doesn’t really exist anymore, how much (or how little) a goaltender’s workload has changed over the decades, the prevalence of back-to-back starts and performance within those starts, as well as team goaltending philosophies or lack thereof. Go read that to get the foundation for what we’ll discuss today, which is how these changes have affected fantasy value, and what it means for the 2026-27 season.
What this does to fantasy value
The strange part is that the seat itself never got cheaper. A 60-start goalie still averages about 35 wins, the same as 2008. The league didn’t devalue the workhorse; it cut the number of chairs. Thirty-five-win seasons have gone from 7-11 per year to three. Thirty-win seasons ranged from 15-17 and are down to 8-10.
And be clear-eyed about what the win column is. Across every team’s No. 1, starts alone explain 59 percent of the variance in wins. Add team quality and you’re at 92 percent. Add the goalie’s actual save talent on top and the model improves by about a tenth of a percentage point: a difference you can detect statistically (p = 0.007) and safely ignore practically. Once you know the starts and the team, save quality tells you essentially nothing more about the win total. (Team quality here means same-season team wins, which contain some of the goalie’s own goaltending, so if anything this accounting hands part of his skill to the “team” column. It bounds how little extra save talent tells you, not how little goaltending matters.) Skill earns a goalie his starts; it doesn’t add wins on top of them.
So here is the multiplier that should sit next to the board: a No. 1 on a strong team (a 55-percent-plus win rate) banks 0.62 wins per start; on a weak team (under 45), 0.40. The same 56-start projection is a 34-win season in Winnipeg and a 22-win season in San Jose. Volume is the ticket; the team decides what the ticket pays.
One more back tested warning: projecting this year’s starts by carrying forward last year’s is worse than knowing nothing. Over the last two seasons that naive method missed by 8.5 starts on average, while guessing the league median missed by 7.0. A rule that regresses returning starters hard toward the mean and hands newcomers the base rate got the error down to 6.1; a paired test says that gap is no fluke (p = 0.003). Usage doesn’t carry. Price that in.
The 2026-27 expected starts board
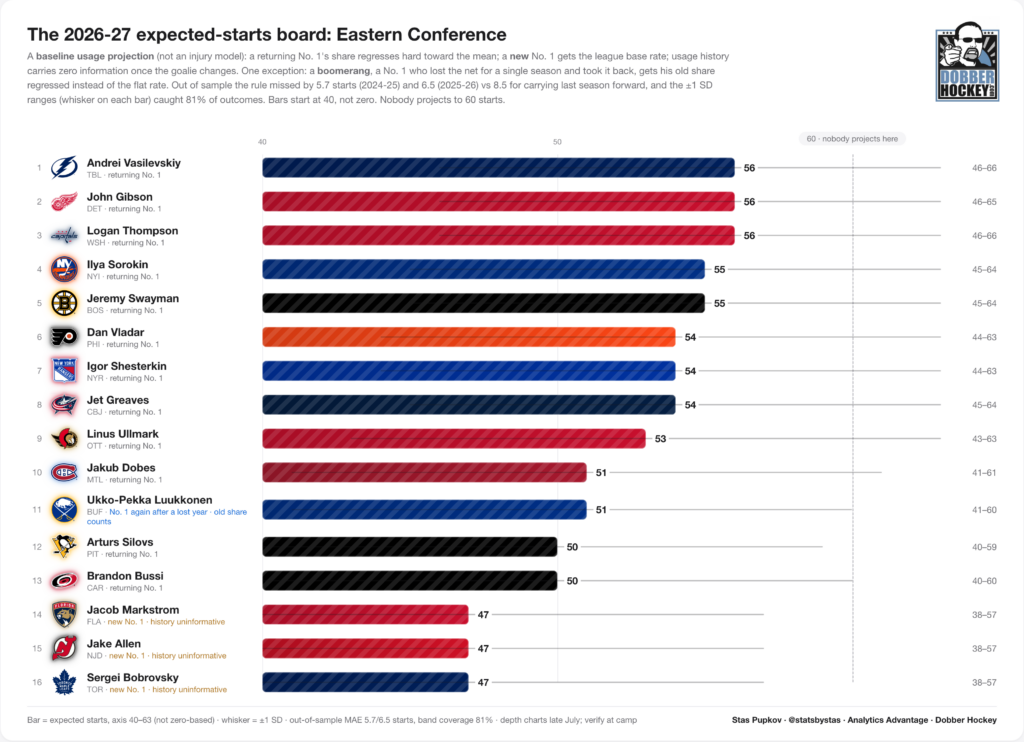
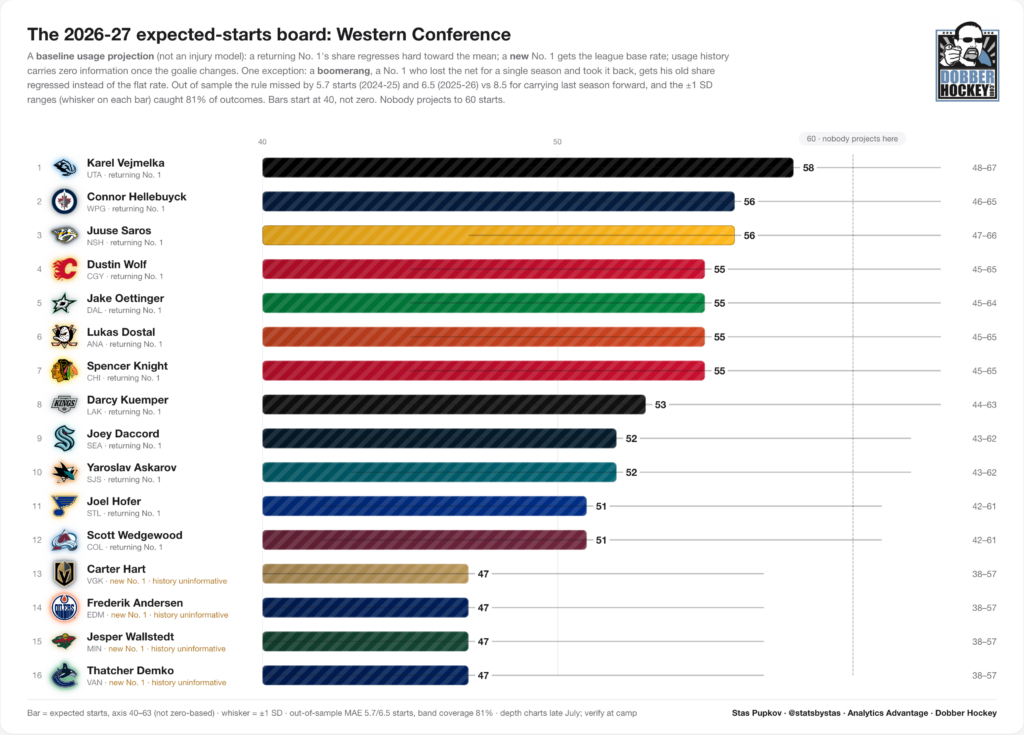
Run that rule across the league’s late-July depth charts and the headline writes itself: nobody projects to 60 starts. But read the board for what it is: a volume forecast, not a goalie ranking. It says Dan Vladar will probably start 54 games for the Philadelphia Flyers. It does not say he’ll be good in them.
Vejmelka tops the board at 58. Next come five at 56: Vasilevskiy, Hellebuyck and Saros from the holdout group, plus John Gibson and Logan Thompson. The 55-start shelf is where draft-day value lives: Sorokin, Jeremy Swayman, Jake Oettinger, Dustin Wolf, Lukas Dostal and Spencer Knight. In wins formats, those twelve 55-plus names are the goalie market. Buy them roughly in order of their teams, not their talent. And note the category flip: Gibson and Vejmelka, high-volume goalies on weak teams, are saves-category gold and wins-category poison. The same board that buries them in one format tops it in the other.
“Returning,” to be precise, means one thing: the projected starter also led his team in starts last season. Anyone else counts as new. Every new-No. 1 situation (Sergei Bobrovsky with the Toronto Maple Leafs, Jacob Markstrom with the Florida Panthers, Frederik Andersen with the Edmonton Oilers, and so on) lands at a flat 47, plus or minus 10, because that’s what the zero correlation above demands.
One exception earns a nudge: the boomerang. A No. 1 who lost the net for one season and took it back has historically kept a strong echo of his old workload (23 cases since 2007; his old share correlates with his comeback share at r = 0.66, p < 0.001). That’s Ukko-Pekka Luukkonen, the Buffalo Sabres' leader two seasons ago: he projects to 51, not 47. Thatcher Demko doesn’t qualify; Kevin Lankinen out-started him two years running, and for two-years-removed cases the data goes quiet. A ±10 band means the floor is 38 starts and the ceiling is 57. In a shallow wins league, that’s a coin flip you don’t need. In a deep league or a keeper, it’s the cheapest 57-start ticket on the board. This is a baseline usage projection, not an injury model. Held out of sample, it missed by 5.7 starts in 2024-25 and 6.5 in 2025-26 (median miss 5.1), and the ±1 SD ranges caught 81 percent of outcomes. Read the bands, not just the bar. Camp battles will move the bottom of the board; verify in September.
The receipts
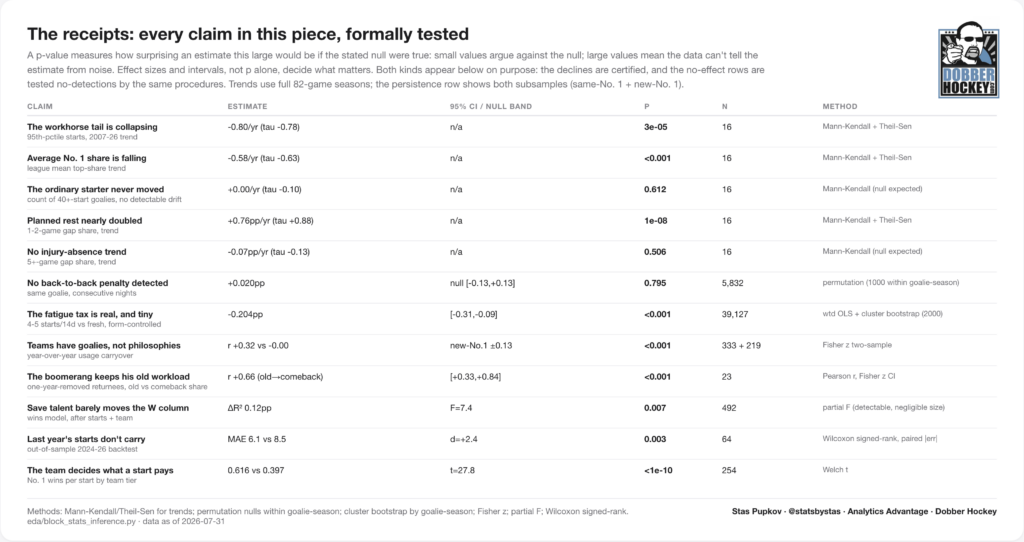
Every claim above went through a formal test: trend tests for the declines, permutation nulls for the folklore, a cluster bootstrap for the fatigue tax, and out-of-sample scoring for the board rule. Figure 7 has the full table: estimate, confidence interval, p-value, sample size and method for all eleven. The two “nothing there” findings are tested no-detections from the same procedures that had no trouble certifying the real trends, not unchecked assumptions.
The playbook
- Pay up inside the 55-start tier, all 12 of them. The 60-start goalies you remember drafting do not exist anymore; 58 is the new ceiling, the mid-50s are the new top shelf, and the tier is a dozen names deep. In wins leagues they’re your top 8-10 goalies off the board, ordered by team quality.
- Draft the starts and the team, not the save percentage. Once volume and team are known, save quality adds essentially nothing to the win column. The multiplier does the work: 0.62 wins per start on a strong team, 0.40 on a weak one.
- Never project a new starter from his team’s history. The correlation is indistinguishable from zero. New man, blank slate.
- Fade “he started 60 last year.” Usage regresses hard; carrying last season forward is worse than knowing nothing. Chase “his coach has nobody else and he’s playing well right now.”
- In wins formats, know why you’re avoiding a team. The Carolina Hurricanes, Pittsburgh Penguins, Vegas Golden Knights, New Jersey Devils, the San Jose Sharks, and the Maple Leafs have split their goalie wins nearly in half over the last three seasons. And even where the split resolves (Yaroslav Askarov projects to 52 starts), the multiplier still rules: a weak team pays 0.40 wins per start no matter who’s in net. In saves and shutout builds, both problems disappear.
- Stop sweating back-to-backs. The goalie-level penalty doesn’t survive contact with the data. Stream the calendar and the opponent, not the physiology.
All data derived from NHL sources: starts and wins from official NHL boxscores, 2007-08 through 2025-26 (2020-21 is missing 67 games of goalie boxscores in every public source, so shares are computed on observed games); historical starts shares from the NHL’s official season records (api.nhle.com), 1917-18 onward; shot-quality adjustment from the author’s expected-goals model built on NHL play-by-play. Modern numbers cross-validated against hockey-reference, used as a check only, never a source. Workload effects calibrated against permutation nulls (1,000 within-goalie-season shuffles) and a 2,000-replicate cluster bootstrap; the expected-starts rule (boomerang branch included, fit on 22 training cases) backtested out-of-sample on 2024-25 and 2025-26 before use. Depth charts via Daily Faceoff, late July. The pull-timing study referenced above is Ali & Mohamed, LINHAC 2026.
Related Posts
Starting Goalies



Top Skater Views
 S.J
S.J ANA
ANA VAN
VAN

Top Goalie Profile Views
| Players | Team | |
|---|---|---|
| JOEL HOFER |
 STL STL | |
| CARTER HART |
 VGK VGK | |
| SCOTT WEDGEWOOD |
 COL COL | |
| JAKUB DOBES |
 MTL MTL | |
| DEVON LEVI |
 EDM EDM
| |
LINE COMBOS
| Frequency |
STL Players
| |
|---|---|---|
| 18.9 | ALEKSANTERI KASKIMAKI ZACH DEAN JUSTIN CARBONNEAU | |
| 17.8 | OTTO STENBERG JACK FINLEY MADDOX DAGENAIS | |
| 16.1 | JAKUB STANCL DYLAN PETERSON JURAJ PEKARCIK | |
DobberHockey Podcasts

Keeping Karlsson: KKUPFL Tier 1 Draft Roundtable
Elan and Brian are joined by several KKUPFL Tier 1 managers, to bring you inside their draft table decisions and thought processes in building the teams competing in the top division of the world’s best fantasy hockey league.

Fantasy Hockey Life: New Jersey Devils with James Nichols
James Nichols joins the program to discuss the New Jersey Devils. Jesse and Victor ask about pros Jack Hughes, Jesper Bratt, Nico Hischier, Timo Meier, Connor Brown, Arseni Gritsyuk, Anthony Mantha, Dougie Hamilton, Luke Hughes, Jake Allen, David Rittich, and Nico Daws. In Cat’s instincts, Cat Silverman of InGoal magazine joins to discuss prospect goalies […]
Fantasy Hockey Life: Nashville Predators with Emma Lingan
Emma Lingan joins the program to discuss the Nashville Predators
Keeping Karlsson: The 2026-27 Keeping Karlsson Breakfast Club
Don’t you forget about them! Elan and Brian remind you of at least one player on each NHL team whose name you might forget to consider at the draft table.
Fantasy Hockey Life: Tampa Bay Lightning with Erik Erlendsson
Erik Erlendsson joins the program to discuss the Tampa Bay Lightning. Jesse and Victor ask about pros Nikita Kucherov, Jake Guentzel, Brandon Hagel, Brayden Point, Anthony Cirelli, Ilya Mikheyev, Gage Goncalves, Conor Geekie, Benjamin Rautiainen, John Carlson, Victor Hedman, Charle-Edouard D’Astous, Andrei Vasilevskiy, Jonas Johansson, and Dennis Hildeby. In Cat’s instincts, Cat Silverman of InGoal […]