

Analytics Advantage: How Much of Last Year’s Success Boston, Buffalo, San Jose, and Philadelphia Can Keep
Stas Pupkov
2026-09-25
Four teams jumped more than 20 points last season. San Jose went from 52 points to 86, Buffalo from 79 to 109, Boston from 76 to 100 and Philadelphia from 76 to 98. Since 2006-07, 51 teams have made a jump like that, and on average they gained 27 points and gave 10 of them back the next year. So the starting assumption for all four should be that they come back down some, and the work is figuring out how much for each one and which fantasy players that actually touches, which turns out to be goalie wins far more than skater points.
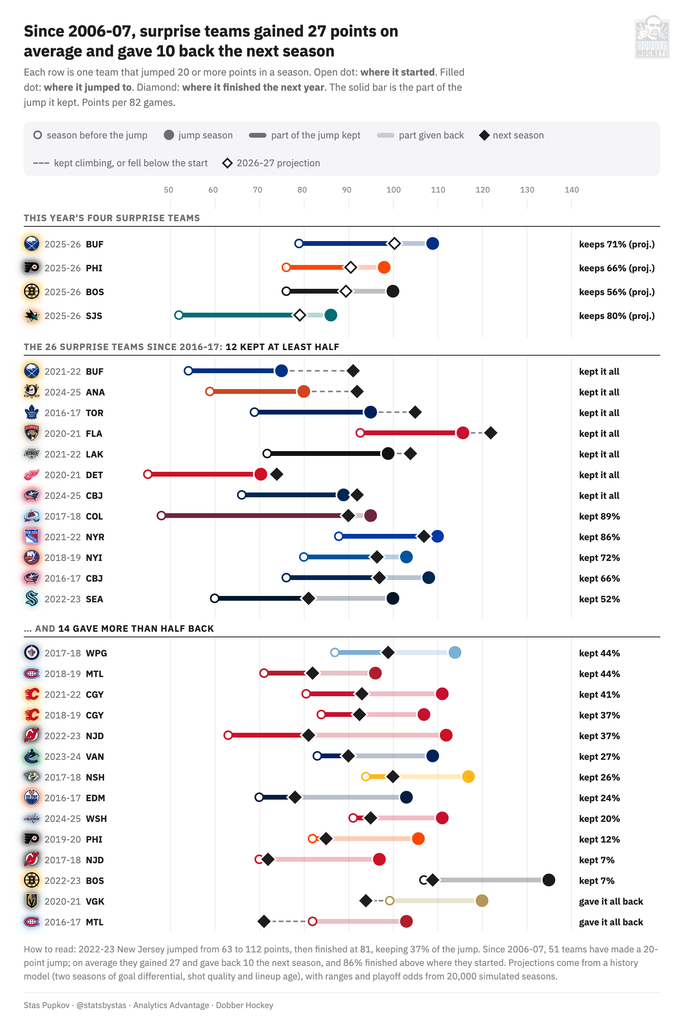
Figure 1
How much comes back
The history in Figure 1 is more forgiving than people tend to expect. Of the 51 teams, 86 percent still finished the next season above where they started, and 57 percent kept at least half of what they gained. The 26 since 2016-17 are in the figure, and 12 of those kept half or more. The four teams at the top use this year's projections, which are over 84 games, scaled down to 82 so they line up with the history, and that is why Buffalo's 103-point projection shows up as keeping 71 percent of its jump.
The size of the drop depends a lot on where the team landed. Teams that jumped to 103 points or more per 82 games gave back 15.1 on average the next season, while teams that landed lower gave back 4.6. Buffalo landed at 109, which puts the Sabres in the group that has historically fallen the most. New Jersey is the example most people remember, going from 63 points to 112 in 2022-23 and then back to 81. Columbus, on the other hand, climbed from 66 to 89 in 2024-25 and then added three more points last season.
The model
To project the four teams I needed inputs that actually repeat from one year to the next. Standings points are a noisy measure, and once you know a team's goal differential, its point total adds nothing to the forecast, so the model leaves it out. It is a plain linear regression on three inputs: goal differential over the last two seasons, the team's share of even-strength shot quality, and the age of the lineup weighted by ice time. Shot quality here means each shot weighted by how often shots like it go in.
I tested it by fitting it only on earlier seasons and forecasting the next one, for every season from 2010-11 through 2024-25, which is 460 team-seasons. The typical miss was 12.6 points. Carrying last season's total forward missed by 15.2, and pulling that total toward the league average missed by 13.3, so the model is better than both. A miss of 12.6 points is still big, though, so every projection comes with an 80 percent range from 20,000 simulated seasons. Each simulation plays out the schedule game by game and shifts every team's strength by one of the model's actual past misses, and in the backtest roughly eight teams in ten finished inside their range.
I also tested the things a Sharks fan would bring up first, which are young stars, rookies credited by draft slot, coaching changes, injuries and preseason results. None of them improved the forecasts on past seasons, so none of them made it into the model. That matters for San Jose later on.
Why some of it comes back and some of it doesn't
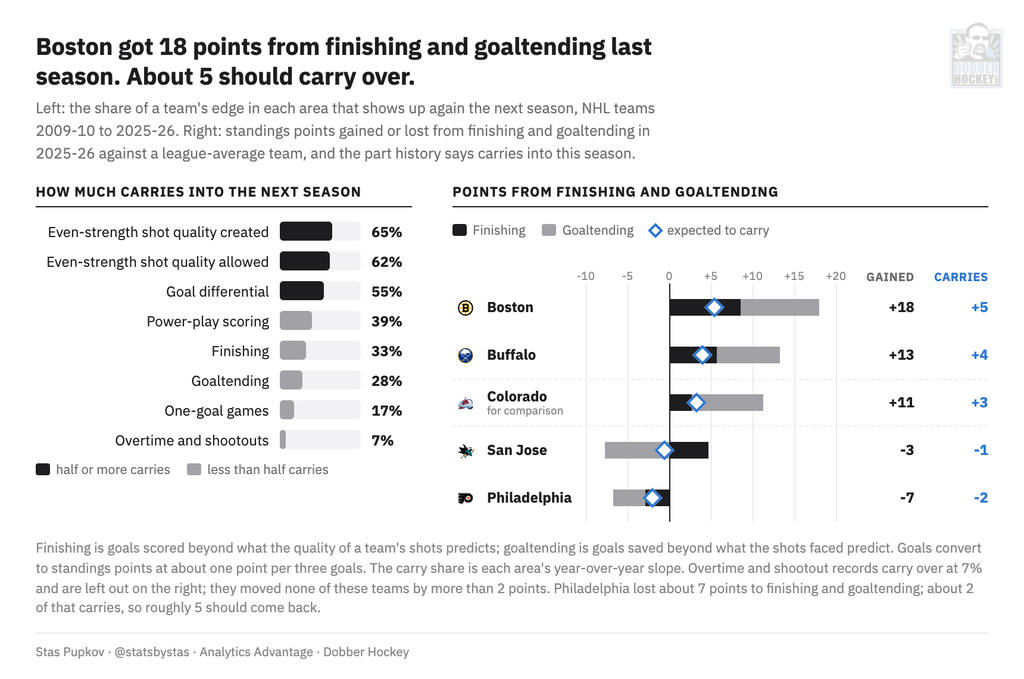
Figure 2
The reason teams give points back is that part of any season is luck, and luck doesn't carry. Figure 2 shows how much of each piece of a team's season shows up again the following year. A team's edge in even-strength shot quality carries over at 62 to 65 percent, and goal differential at 55 percent. Finishing, which is goals scored beyond what the shots should produce, carries at 33 percent, and goaltending, goals saved beyond what the shots faced should allow, carries at 28. One-goal games are at 17 percent and overtime and shootout records are at 7.
That means the question for each team is how much of its jump came from the parts that carry. Boston leaned on the parts that don't. The Bruins were 26th in shot-quality share and still finished +22, because their shooters and goalies were worth roughly 18 points more than a league-average team's, which is the most of the four, and history says only about 5 of those 18 points carry over. Buffalo got about 13 points from finishing and goaltending, and around 4 of those should stick. Philadelphia actually lost about 7 points to finishing and goaltending, so if history holds, around 5 of those come back to them. San Jose's shooters added about 5 points and its goalies cost about 8, which leaves the Sharks close to even.
The four teams
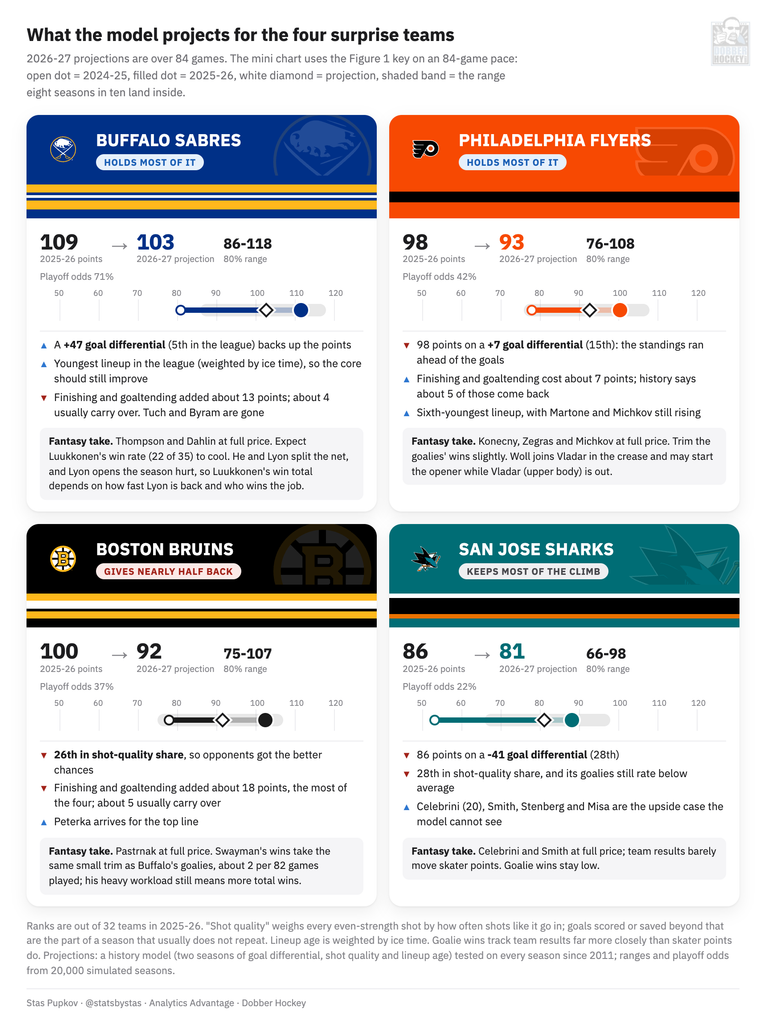
Figure 3
Putting that together, Buffalo holds up best. The Sabres' +47 goal differential was fifth in the league, their shot-quality share was about even at 13th, and their lineup was the youngest in the league by ice time, all of which carry. Then you take off the 13 points of finishing and goaltending, the departures of Alex Tuch (33 goals) and Bowen Byram, and the fact that they landed at 109, and the model ends up at 103 points over 84 games, with an 80 percent range of 86 to 118 and 71 percent playoff odds.
Philadelphia is the case where the standings ran ahead of the goals. The Flyers got 98 points on a +7 goal differential, 15th in the league, and part of that came from extra time, since 28 of their games went past regulation, second only to Los Angeles's 33, and they won 16 of them. Overtime records only carry at 7 percent, so that part mostly goes away. But their finishing and goaltending were below average, which should swing back their way, and the lineup was the sixth-youngest in the league, so the model still keeps most of the jump at 93 points (76 to 108) and 42 percent playoff odds. Matvei Michkov had 51 points and opens camp on the top power-play unit with Trevor Zegras and Porter Martone.
Boston gives back the most of the four, about 44 percent of the jump, because so much of it came from finishing and goaltending on a team that was 26th in shot-quality share. The model has the Bruins at 92 (75 to 107) with 37 percent playoff odds. Charlie McAvoy also starts the season serving a six-game suspension. JJ Peterka comes in and opens camp on the first line with Elias Lindholm and David Pastrnak.
San Jose is the projection I trust least, and the reason goes back to what the model can't see. The Sharks were outscored by 41 (28th), ranked 28th in shot-quality share, and got .884 goaltending from Yaroslav Askarov over 47 games and .896 from Alex Nedeljkovic over 40, and they won 12 of their 20 games past regulation. On those inputs the model lands at 81 (66 to 98) with 22 percent playoff odds. But the 86 points came with Macklin Celebrini, now 20, putting up 115 and Will Smith scoring 59 in 69 games, Darnell Nurse and Jacob Trouba join the defense, and the model has no way to give a 20-year-old credit for getting better, because that kind of term didn't help on past teams. So Celebrini, Smith, Michael Misa and Ivar Stenberg are the upside case. The range tops out at 98, but that range only reflects the model's normal miss, with no credit for the young players getting better, so if they take a real step, it comes on top of what the model sees.
What it means for your draft
The team numbers only matter for fantasy if players' stats move with them, so I checked that too. Across 6,540 cases of a skater playing at least 40 games for the same team in back-to-back seasons (the same player can show up more than once), every 10 points the team gained or lost moved the skater's own total by 1.5 points per 82 games, and team results explained 3 percent of the change. Before the season, when the team's drop is itself a projection, that effect is under one point. So Tage Thompson (81 points), Rasmus Dahlin (74), Pastrnak (100 in 77 games), Travis Konecny (68), Zegras (67), Michkov, Celebrini and Smith should be drafted where their own numbers put them, and a projected team slide is no reason to move any of them down.
Goalie wins are where the team result shows up. Across 523 goalie cases built the same way, with at least 25 games in both seasons, 10 team points moved wins by 4.9 per 82 games played, and team results explained 56 percent of the change. Goalies on the 51 jump teams won 5.7 fewer games per 82 the next season and their save percentage fell by .0075, although most of that was the goalies' own numbers drifting back to average. The part that comes from the team's projected drop alone is 1.3 to 1.7 wins per 82 for these four clubs, so the goalies take a small trim.
Ukko-Pekka Luukkonen won 22 of 35 with a .910, and that win rate should come down. He and Alex Lyon split the net almost evenly last season, 35 games to 36, and Lyon starts this season hurt, so Luukkonen's total depends on how fast Lyon gets back and who ends up with the job. Jeremy Swayman won 31 of 55 with a .908 and takes the same small trim as the Buffalo goalies, and because he plays more, he still has the best chance at a big win total in this group. Dan Vladar won 29 of 52 (.906) and is out with an upper-body injury, so Joseph Woll, who is new to the Philadelphia crease, may start the opener. Askarov won 21 of 47 in San Jose, and on a team projected for 81 points his win total probably stays around there.
Numbers: NHL regular-season results through 2025-26 and official standings. Points per 82 games where labelled, projections over 84 games. Shot quality, finishing and goaltending come from the author's expected-goals model, checked against Natural Stat Trick. Projections are a linear regression on goal differential over two seasons, shot-quality share and ice-time-weighted lineup age, backtested on 2010-11 to 2024-25 (typical miss is root-mean-square error), with ranges and playoff odds from 20,000 simulated seasons. Camp lines and injuries as of September 25, 2026.
Related Posts

Starting Goalies



Top Skater Views
 S.J
S.J CBJ
CBJ CHI
CHI UTA
UTA

Top Goalie Profile Views
| Players | Team | |
|---|---|---|
| DAN VLADAR |
 PHI PHI | |
| SCOTT WEDGEWOOD |
 COL COL | |
| SERGEI MURASHOV |
 PIT PIT | |
| CARTER HART |
 VGK VGK | |
| JOEL HOFER |
 STL STL
| |
LINE COMBOS
| Frequency |
 TOR Players TOR Players
| |
|---|---|---|
| 19.6 | VINNI LETTIERI TINUS LUC KOBLAR BRENDAN BRISSON | |
| 19.4 | STEVEN LORENTZ BRANDON DUHAIME TEDDY BLUEGER | |
| 16.6 | RYAN TVERBERG JACOB QUILLAN LUKE HAYMES | |
DobberHockey Podcasts

Fantasy Hockey Life: Dallas Stars with Taylor Newby
Taylor Newby joins the program to discuss the Dallas Stars.

Keeping Karlsson: KKUPFL Tier 1 Draft Roundtable
Elan and Brian are joined by several KKUPFL Tier 1 managers, to bring you inside their draft table decisions and thought processes in building the teams competing in the top division of the world’s best fantasy hockey league.
Fantasy Hockey Life: New Jersey Devils with James Nichols
James Nichols joins the program to discuss the New Jersey Devils. Jesse and Victor ask about pros Jack Hughes, Jesper Bratt, Nico Hischier, Timo Meier, Connor Brown, Arseni Gritsyuk, Anthony Mantha, Dougie Hamilton, Luke Hughes, Jake Allen, David Rittich, and Nico Daws. In Cat’s instincts, Cat Silverman of InGoal magazine joins to discuss prospect goalies […]
Fantasy Hockey Life: Nashville Predators with Emma Lingan
Emma Lingan joins the program to discuss the Nashville Predators
Keeping Karlsson: The 2026-27 Keeping Karlsson Breakfast Club
Don’t you forget about them! Elan and Brian remind you of at least one player on each NHL team whose name you might forget to consider at the draft table.