Frozen Tools Forensics: Home sweet home
Chris Kane
2020-11-27
This week we are going to take a slight about-face from our recent work. We have been focusing a lot on point production (here and here) and multi-category players (here and here), diving into players who excel, or who could break out in those various categories. This week we are going to take a bit of a bigger picture look at the league and how players accrue those stats. Specifically we are going to be looking at home versus away games and where players pick up stats.
This week on Frozen Tool Forensics: There's No Place Like Home
So why home vs away? Well there is a Dobber Report for one thing – and getting a handle on topics like these can provide a nice edge in your fantasy considerations.
Now in the most general terms an NHL team plays 41 home games and 41 away games. Often teams end up with better home records than away records. There are lots of theories, home crowd, travel, unfamiliar rink, officiating etc. but how does it impact players?
To explore I first pulled the Home/Away report from Frozen Tools. As per usual I exported so I could play with the data a bit more. The report breaks down general scoring stats across home games and away games. It covers games played, goals, assists, points, power-play goals, power-play points, penalty minutes, hits, and shots.
My first step was to put the data into a more comparable form. I turned each stat (for home and away games) into a per-game metric. I was then able to compare a player's home production to their away production.
For example, Victor Hedman took 103 shots in 34 home games (3.03 shots-per-game), and 52 shots over 32 away games (1.625 shots-per-game). That means he took 1.405 fewer shots-per-game during away games than home games. The stat-per-game metric is really helpful when thinking about a specific category for a player, but if we want to compare the impact on his shots to the impact on his points pure rates don't help much (as shots and points happen at a much different pace).
I am going to admit right up front that this analysis process is a little confusing to explain. We end up with a percentage number, but it is easiest to think about it as a ranking – so the higher the percentage the better a person did at home. If that is all you want to know feel free to skip the next couple of paragraphs.
To compare across categories I decided to look at the difference between home and away games in a category and the player's per-game average in that category. In Hedman's case it means that the 1.405 shots per game drop during away games is about 60 percent (59.8) of his average shots per game across all games. It doesn't necessarily mean that 60 percent of his shots came at home, just that he was more productive at home, and by comparing it to his average shot numbers we can put it in terms that are comparable across categories. Basically, just remember that positive percentages indicate that a player produces better at home, and negative percentages mean better in away games.

If we look at points, then Hedman's 63.1 percent in the points category means he should have produced more points-per-game at home than in away games. If we look at the data, he put up 37 points in 34 home games, and 18 points in 32 away games. The benefit of comparing this way is that it shows us that Hedman was similarly productive at home in both the shots and points categories. On the flip side he was significantly less productive at home in hits, where he came in at -8.81% (which translates to 1.06 hits-per-game at home and 1.15 hits-per-game during away games). The same is true for penalty minutes.
So, which players are the most productive at home? If we do a little filtering, and take a player's average across the categories, we get the top five below.

As we saw with Hedman the percentage by itself is less valuable than its comparative value. Hedman's 157.72 percent in goals means he saw a lot more of his goals at home than Bryan Rust (40.69 percent), but fewer of his assists (39.43 percent compared to Rust's 79.52 percent).
On the flip side we have five players who seem to be significantly more productive during away games.

Based on this data, if you are trying to decide between Rust and Tomas Tatar and they both have home games you might want to go with Rust. Though it does remain to be seen if this is a repeatable phenomenon season to season, or if it is just a fluke.
Ok great, so what else can we do with this? Well my big question is, is there a league wide difference between home and away games in any of these categories? I mean if we know players score a ton more points at home, then we might lean toward the home game in our sit/start decisions. With a data set this big we should be able to pull out some interesting information.
So again for the process discussion. I had numbers for everyone in the league (thanks to the Home/Away report and my percentages explained above) so I started with a standard deviation in each category to see if there was one stat category that had a larger fluctuation in the values between home and away games. It turns out there was a pretty significant difference. The shots category was much more consistent than power-play goals. But there was a problem. The changes in variation seemed to be pretty aligned with total stat count. In other words, low frequency events like power-play goals had a ton of variation (meaning big differences between home and away numbers) and high frequency events like shots and hits did not. So basically we were dealing with a sample size issue.
Because I used percentages as a way to compare, the other issue (it is actually still a sample size issue) is that players who only have a few of a stat are more likely to have huge percentages. For example, a person who scores five goals, with four of them at home looks really different than someone who scores 45 with 24 at home (and 21 away) even though the difference in both cases is three goals. In an attempt to account for that I put in a floor for each stat so players' data wouldn't be counted unless they met the threshold.
Low and behold something changed. The table below shows the total count in each stat (meaning that there were 6302 goals in our data set), and it shows the average percentage was across all counted players in the category.
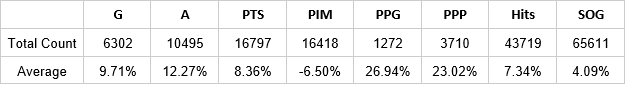
So, on average the players who met the goal scoring threshold were more likely (at 9.71 percent) to score at home than away. Again the 9.71 percent is more valuable as a comparison tool to the other categories than by itself. For example we can see that power-play points are more than twice as high as goals (meaning power-play points are much more skewed to home games), and shots are less than half (meaning shot production is more evenly split between home and away games than goals).The home rink advantage holds true for all the categories except penalty minutes, which at -6.5 percent is more likely to happen at an away game.
If we are talking scale here, power-play goals and power-play points are still much more likely than any other category to vary by home and away games, and shots significantly less so. If you look at the counts it still means we have some frequency bias here. There is still a clear trend line for frequency, but this means we have an idea of where we would expect a stat to be based on its frequency and can tell if one of these stats is way off that trend line.
In this case there are three off trend stats; penalty minutes, power-play points, and power-play goals. Based on the trend line penalty minutes happen at away games much more than we would anticipate, and power-play points and goals happen much more at home games than we would anticipate. They are all related (if the away team gets called for more penalties, the home team has a better chance for power-play points), and what’s more they are all related to officiating, which is a prevailing theory for the home rink advantage.
It is nice to see it all come back full circle. The general take-away seems to be that while it does vary a bit by player, if a sit/start decision comes down to two even players, tie goes to the home game, particularly if the player is on the power-play.
That is all for this week. Thanks for reading.
Stay safe out there.
Want more tool talk? Check out these recent Frozen Tool Forensics Posts.
Frozen Tool Forensics: Multi-Cat Defensemen
Frozen Tools Forensics: Bubble Keeper Week with Gaudette, Hyman, and more
Frozen Tool Forensics: Multi-Cat Forwards
Related Posts


UPCOMING GAMES
| Apr 26 - 19:04 |
| vs |
| |
| Apr 26 - 19:04 |
| vs |
| |
| Apr 26 - 22:04 |
| vs |
| |
| Apr 26 - 22:04 |
| vs |
| |
Starting Goalies
Top Skater Views
Top Goalie Profile Views
LINE COMBOS
| Frequency |
| |
|---|---|---|
| 25.9 | FABIAN ZETTERLUND MIKAEL GRANLUND WILLIAM EKLUND | |
| 12.5 | JACK STUDNICKA GIVANI SMITH RYAN CARPENTER | |
| 12.0 | LUKE KUNIN KLIM KOSTIN DANIL GUSHCHIN | |
DobberHockey Podcasts

Fantasy Hockey Life: Salary Cap Basics Remix
If you missed last year’s series on salary leagues, this is a remix with some bonus material. Jesse and Victor discuss the different ways you can step up your dynasty league with a salary component. Our show is part of the Dobber Podcast Network and sponsored by Fantrax.com. Email [email protected] and ask to join our […]

Keeping Karlsson: No. 533 – Ultimate Champion Interview + Playoff Preview
On this week’s Keeping Karlsson Fantasy Hockey Podcast mega-show, Elan and Brian gather and analyze the latest fantasy hockey news, notes and data.
Fantasy Hockey Life: Tim-Eh’s Time in the TIDY Top Tier
When one of the managers in the TIDY league top tier left midseason, Patron Tim volunteered to give up his excellent team to take over a mid-season orphan fighting to escape relegation. And Tim did not go quietly. Ryan, Jesse and Victor welcome Tim to talk through his experience and the trades he made in […]
Keeping Karlsson: Better Off Nedeljkovic
On this week’s Keeping Karlsson Fantasy Hockey Podcast mega-show, Elan and Brian gather and analyze the latest fantasy hockey news, notes and data from the past season to work on projecting the 2023-24 NHL and fantasy hockey season. — Join the Keeping Karlsson patron community! Patrons get guaranteed KKUPL invitations, plus monthly bonus AMA episodes, and full access to […]
Fantasy Hockey Life: FHL Player Cards with Brandon
Our guy Brandon has been doing great work behind the scenes to great Fantasy Hockey Life prospect player cards, visualizations with the metrics we care about most – including BASH. These are a great tool to catch at a glance the stats for upcoming players. Jesse interviews Brandon and Victor on the decisions behind what […]