Analytics Advantage: Takeaways/Giveaways, Shot Attempts/Points Per Game, and Player Involvement
Stas Pupkov
2023-10-26
Welcome back. I hope everyone had an amazing experience watching frozen frenzy; it's good to see ESPN capitalizing on the uber-popular NFL Redzone. As the NHL season gains momentum, so should your fantasy strategies. This week, we’re diving into two intriguing metrics that could be game changers for your team: Takeaways vs. Giveaways and iCF vs. Points per Game (PPG).
It's easy to get swept up in the headline-grabbing statistics like goals, assists, and save percentages. However, there exists a trove of lesser-known metrics that can offer invaluable insights into a player’s overall performance and potential impact. As the NHL season is just getting underway, it’s the perfect opportunity to explore these often-overlooked statistics, such as Takeaways, Giveaways, Individual Corsi For (iCF), and Points per Game (PPG). These nuanced metrics can provide a granular understanding of a player’s on-ice contributions, setting the stage for more sophisticated and informed fantasy roster decisions as the season progresses. As we find ourselves in the early chapters of the NHL season, it’s essential to exercise caution when interpreting statistical data.
A Caveat for Early-Season Data
As we metrics at this stage come with a caveat: they are based on a limited set of games, making them susceptible to outliers and fluctuations. While it’s tempting to make early assessments, it’s wise to treat these initial figures as preliminary indicators rather than definitive judgments. However, that doesn’t mean this data is without value. On the contrary, it offers a unique opportunity to identify emerging patterns and potential trends that may become significant as the season unfolds. Recognizing the limitations of early-season data can help fantasy managers avoid hasty decisions while setting the stage for more nuanced analysis later.
Unpacking Takeaways and Giveaways
In the complex realm of fantasy hockey, Takeaways and Giveaways often fly under the radar, yet they carry a wealth of information. A Takeaway is more than just a statistic; it’s a signal of a player’s defensive aptitude and a testament to their skill in regaining control of the puck. It reflects not just individual brilliance but also a player’s ability to read the game, intercept passes, and disrupt the opponent’s strategy. Conversely, Giveaways serve as a cautionary tale. They can expose a player’s lapses in concentration, decision-making, or even skill level in puck-handling. A high number of Giveaways could indicate a player prone to making mistakes that lead to turnovers, potentially affecting not just the outcome of a game but also their fantasy value.
Decoding the Quadrants: A Compass for Fantasy Managers
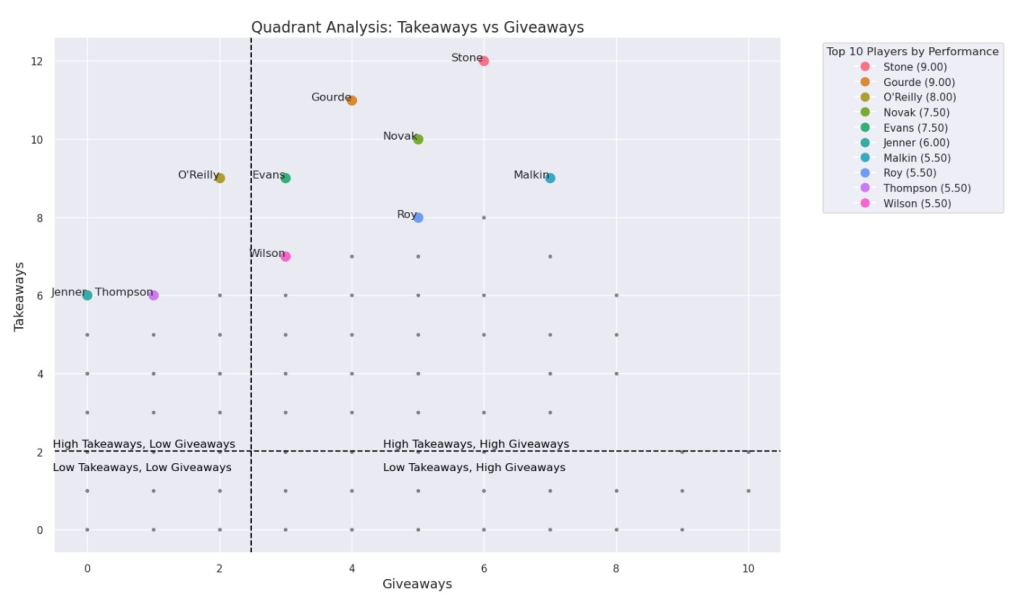
The Takeaways vs Giveaways quadrant analysis serves as a multi-dimensional compass for fantasy managers. This graph segments players into four distinct quadrants, each offering unique insights into player performance in the context of Takeaways and Giveaways.
- High Takeaways, Low Giveaways: Players in this quadrant, like Mark Stone, demonstrate a superior balance of offense and defense. They excel in both stealing the puck and maintaining possession, making them valuable assets even if they don’t headline the scoring charts.
- High Takeaways, High Giveaways: These players are high-risk, high-reward options. They are active in both taking and giving the puck, suggesting a dynamic but perhaps inconsistent style of play.
- Low Takeaways, Low Giveaways: Players here are often less involved in puck possession battles, which might indicate a more conservative or defensive role on their team.
- Low Takeaways, High Giveaways: This is the quadrant fantasy managers may want to be wary of. Players here have a tendency to lose the puck more often than they regain it, which could be a liability.
Understanding the nuances of these quadrants allows fantasy managers to make more informed decisions, adding a layer of sophistication to their roster-building strategies.
The Underlying Complexity of iCF and PPG: More Than Meets the Eye
While iCF and PPG may not be the marquee stats in fantasy hockey, they offer a layer of complexity that can be incredibly revealing. Individual Corsi For (iCF) serves as an aggregate measure of a player’s total shot attempts, providing insight into their level of offensive activity and puck possession. It captures not just shots that hit or miss the net, but also blocked shots, painting a comprehensive picture of a player’s offensive engagement. Points per Game (PPG), on the other hand, narrows the focus to scoring efficiency. It provides a rate-based measure that encapsulates how effectively a player converts their time on ice into tangible points. Players with high PPG values are often key contributors in crucial game situations, capable of making a big impact in a short amount of time.
Navigating the Quadrants
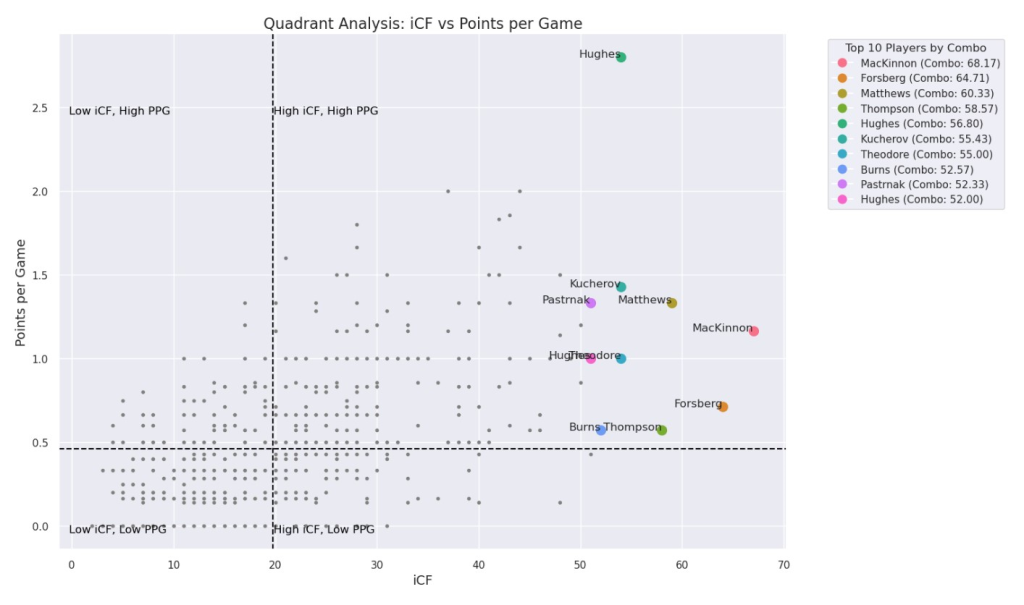
Similar to the Takeaways vs Giveaways quadrant, the iCF vs PPG graph segments players into four illuminating quadrants that can serve as a roadmap for fantasy hockey managers.
- High iCF, High PPG: Players in this quadrant, such as Filip Forsberg, are the epitome of offensive efficiency. They not only take numerous shots but also have a high rate of converting these into points.
- High iCF, Low PPG: These are the players who are highly active in taking shots but might be facing issues in actual point conversion. They could be strong candidates for a breakout if their shooting luck improves.
- Low iCF, High PPG: These players are the opportunists. They may not take as many shots, but they have a knack for making them count, often scoring in critical game situations.
- Low iCF, Low PPG: Players in this quadrant may be struggling to make a significant impact on the game, both in terms of shot-taking and point-scoring. They might be best avoided in fantasy drafts until they show signs of improvement.
Understanding the dynamics of these quadrants can enrich your strategy, allowing you to scout for players who excel in these less recognized but highly impactful metrics. As we venture further into this NHL season, understanding these nuanced metrics will become increasingly important for fantasy managers. While the data is still in its early stages and must be interpreted cautiously, it provides us with a preliminary framework to assess player value beyond the headline stats. The quadrant analyses for Takeaways vs Giveaways and iCF vs PPG offer a comprehensive lens through which to evaluate players, bringing both the art and the science of fantasy hockey into sharper focus. Secondly, as we collect more data, these metrics will serve as valuable tools for fine-tuning your fantasy strategy, whether you’re looking to dominate your league or just enjoy the complexities of hockey from a new perspective. Remember, the most successful fantasy managers are those who adapt and evolve, and these advanced metrics provide the perfect opportunity to do just that.
Related Posts
UPCOMING GAMES
| Apr 28 - 14:04 |
| vs |
| |
| Apr 28 - 17:04 |
| vs |
| |
| Apr 28 - 20:04 |
| vs |
| |
| Apr 28 - 22:04 |
| vs |
| |
Starting Goalies
Top Skater Views
| Players | Team | |
|---|---|---|
| AUSTON MATTHEWS |
| |
| SETH JARVIS |
| |
| MATTHEW TKACHUK |
| |
| ZACH HYMAN |
| |
| WYATT JOHNSTON |
| |
Top Goalie Profile Views
LINE COMBOS
| Frequency |
| |
|---|---|---|
| 27.9 | RYAN O'REILLY GUSTAV NYQUIST FILIP FORSBERG | |
| 15.7 | COLE SMITH KIEFER SHERWOOD MICHAEL MCCARRON | |
| 14.6 | JASON ZUCKER COLTON SISSONS ANTHONY BEAUVILLIER | |
DobberHockey Podcasts

Fantasy Hockey Life: Salary Cap Basics Remix
If you missed last year’s series on salary leagues, this is a remix with some bonus material. Jesse and Victor discuss the different ways you can step up your dynasty league with a salary component. Our show is part of the Dobber Podcast Network and sponsored by Fantrax.com. Email [email protected] and ask to join our […]

Keeping Karlsson: No. 533 – Ultimate Champion Interview + Playoff Preview
On this week’s Keeping Karlsson Fantasy Hockey Podcast mega-show, Elan and Brian gather and analyze the latest fantasy hockey news, notes and data.
Fantasy Hockey Life: Tim-Eh’s Time in the TIDY Top Tier
When one of the managers in the TIDY league top tier left midseason, Patron Tim volunteered to give up his excellent team to take over a mid-season orphan fighting to escape relegation. And Tim did not go quietly. Ryan, Jesse and Victor welcome Tim to talk through his experience and the trades he made in […]
Keeping Karlsson: Better Off Nedeljkovic
On this week’s Keeping Karlsson Fantasy Hockey Podcast mega-show, Elan and Brian gather and analyze the latest fantasy hockey news, notes and data from the past season to work on projecting the 2023-24 NHL and fantasy hockey season. — Join the Keeping Karlsson patron community! Patrons get guaranteed KKUPL invitations, plus monthly bonus AMA episodes, and full access to […]
Fantasy Hockey Life: FHL Player Cards with Brandon
Our guy Brandon has been doing great work behind the scenes to great Fantasy Hockey Life prospect player cards, visualizations with the metrics we care about most – including BASH. These are a great tool to catch at a glance the stats for upcoming players. Jesse interviews Brandon and Victor on the decisions behind what […]