

Analytics Advantage: First-Round Preview Between the Philadelphia Flyers and Pittsburgh Penguins
Stas Pupkov
2026-04-17
Honestly, it’s a surprise to most people that either of these teams even made the playoffs, let alone both. This matchup wasn’t circled in August or even in December — it came together late, and now it’s the Pennsylvania rivalry we didn’t see coming. The City of Brotherly Love versus the Steel City. A Metropolitan bracket gift in the best possible sense.
Pittsburgh and Philadelphia ended the 2025-26 regular season in a dead tie at 98 points, 82 games played, and an identical .598 points percentage — but the records got there by opposite routes and the teams barely look like they play the same sport on the ice. Pittsburgh is star-driven, high-event, and loud. Philadelphia is tight, structured, and defensive. Pittsburgh shoots 28.6 times a game and gives up 27.4. Philadelphia shoots 25.5 and gives up 25.5, basically a mirror on both ends.
They split the season series 2-2, but both Flyer wins came in the shootout. The Flyers are 10-4 in shootouts overall; the Penguins are 3-10. That’s a 13-point swing in the standings that came entirely after 65 minutes of hockey, and two of those losses came at Pittsburgh’s expense.
I pulled every shot, every shift, and every play-by-play event from the NHL API through April 15 for the full 2025-26 season and threw it all in my database. 82 games per team. Let’s get into it.
The Basics — How These Teams Stack Up
Both teams are tied at 98 standings points, but the path there is completely different. Pittsburgh went 41-25-16 with 293 goals for and 268 against — +25 goal differential, 10th in the NHL. Philadelphia went 43-27-12 with 250 goals for and 243 against — +7 differential, 15th. Pittsburgh’s 293 goals-for rank third in the entire league, behind only Colorado and Carolina. Philadelphia’s 243 goals against rank ninth — a full tier better than Pittsburgh’s 268 (25th). It’s a classic offense-versus-defense matchup wrapped around the same standings result.
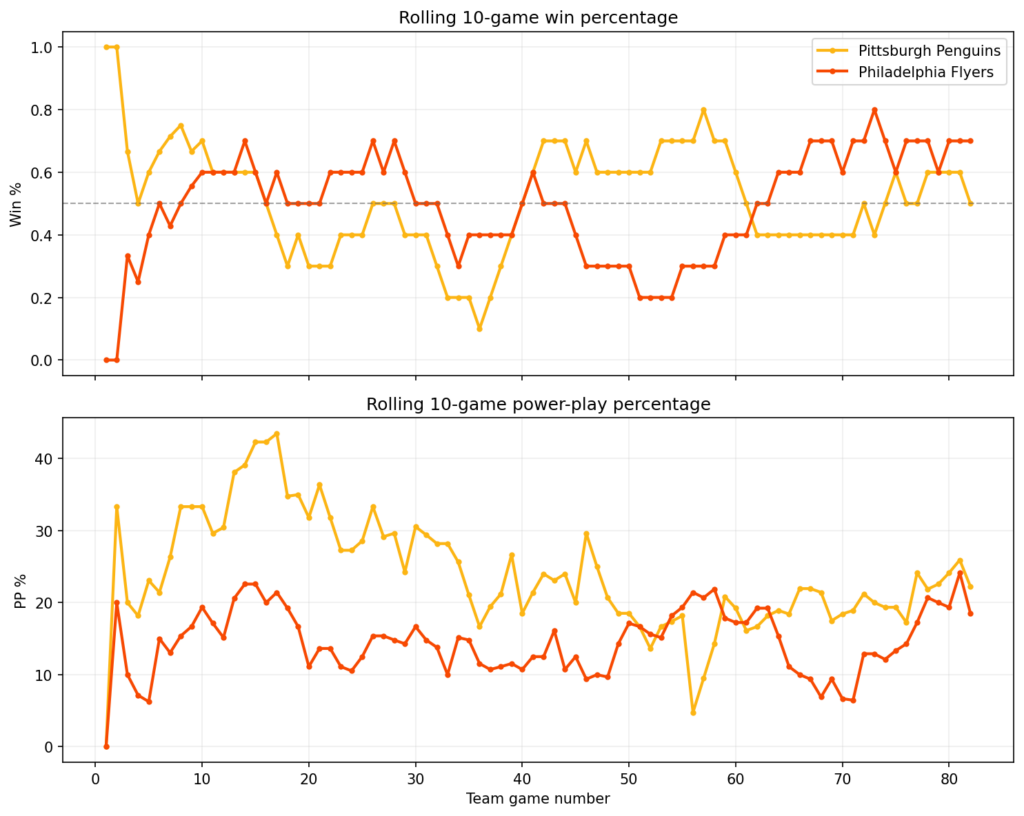
The rate stats reinforce it: Pittsburgh 3.57 goals per game, 3.27 against; Philadelphia 3.05 for, 2.96 against. Pittsburgh shoots 12.5% (fourth in the league) on 2,343 shots. Philadelphia shoots 12.0% (seventh) on 2,088 — 255 fewer attempts over the full year. The Flyers also gave up 157 fewer shots against. Pittsburgh plays loud while Philadelphia plays quietly.
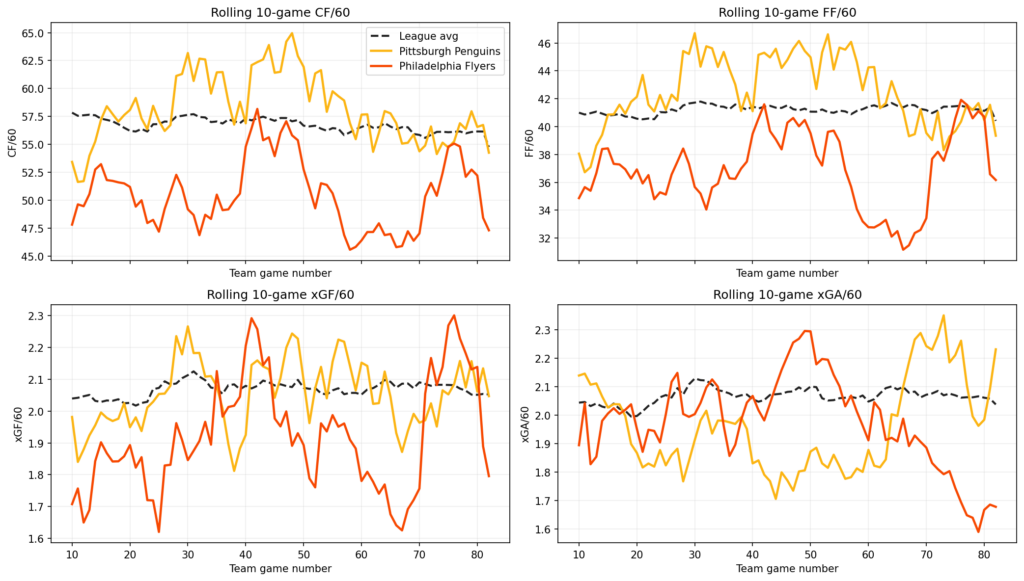
The rolling 10-game chart captures the late-season mismatch. Pittsburgh’s xGF/60 was strong through most of the year but has slipped since the Olympic break. Philadelphia’s has climbed, and its xGA/60 has tightened dramatically — the Flyers defense has figured something out late. Since February 25, Philadelphia has gone 18-7-1 for 37 points at a .712 points percentage. Pittsburgh has gone 12-10-4 for 28 points (.538). Over the last 10, Philadelphia is 7-3 on a three-game winning streak; Pittsburgh is 5-5 and limping in on a three-game losing skid.
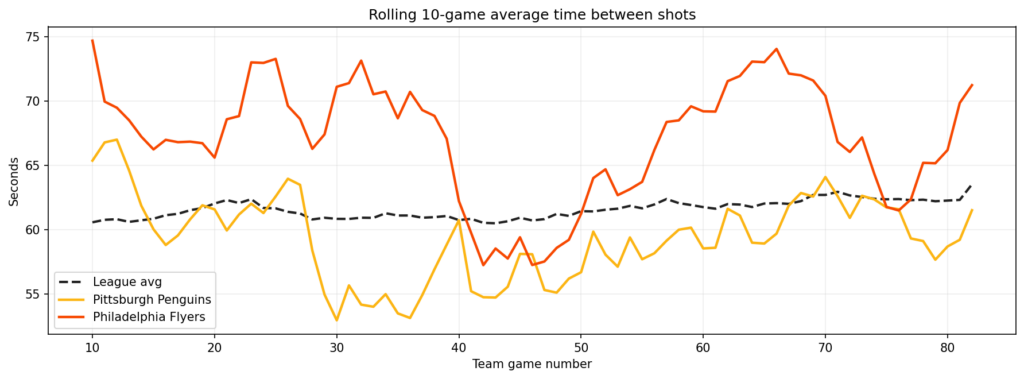
Pittsburgh’s shot-pace chart shows a team that generates offense by piling on attempts — their time between shots runs below league average for much of the year. Philadelphia sits well above league average, roughly seven seconds slower per attempt. Pittsburgh’s possession drives their +25 differential but also concedes more chances the other way. Tight playoff hockey rewards teams that don’t over-extend — Philadelphia’s game plays more naturally inside the postseason template.
Situational Records and the Problem With Holding a Lead
When Philadelphia scores first, they win 72% of the time (24-9, ninth in the NHL). When Pittsburgh scores first, they win 67% (31-15, 21st). The gap widens as leads grow. Philadelphia leading by 1+ is 39-11 (78%, fifth in the league). Pittsburgh is 41-22 (65%, 23rd). Leading by 2+, Philadelphia is .906 (10th); Pittsburgh is .850 (22nd). Even up three, Pittsburgh’s .879 ranks 30th in the league. The Penguins cough up multi-goal leads more often than almost anybody.
What partially balances it is that Pittsburgh is one of the best comeback teams in the NHL. Trailing by 2+, their .231 win percentage is second in the league. Trailing by 3+, they’re 2-17 — two three-goal comebacks, third-best. That’s the volatility: leads given back, leads clawed out. Philadelphia is closer to neutral in both directions.
Home and away is an oddity. Both teams have identical 20-13-8 home records. Philadelphia’s road mark (23-14-4) edges Pittsburgh’s (21-12-8) in regulation wins. The bigger split is tight games: Philadelphia is 17-17 (.500) in one-goal games, Pittsburgh is 12-23 (.343). That’s a 13-point disparity in a bucket covering 35 games for Pittsburgh. In hockey, one-goal games are where the cleaner roster wins more often. Philadelphia’s plays cleaner.
Shot Maps — Where They Score and Where They Bleed
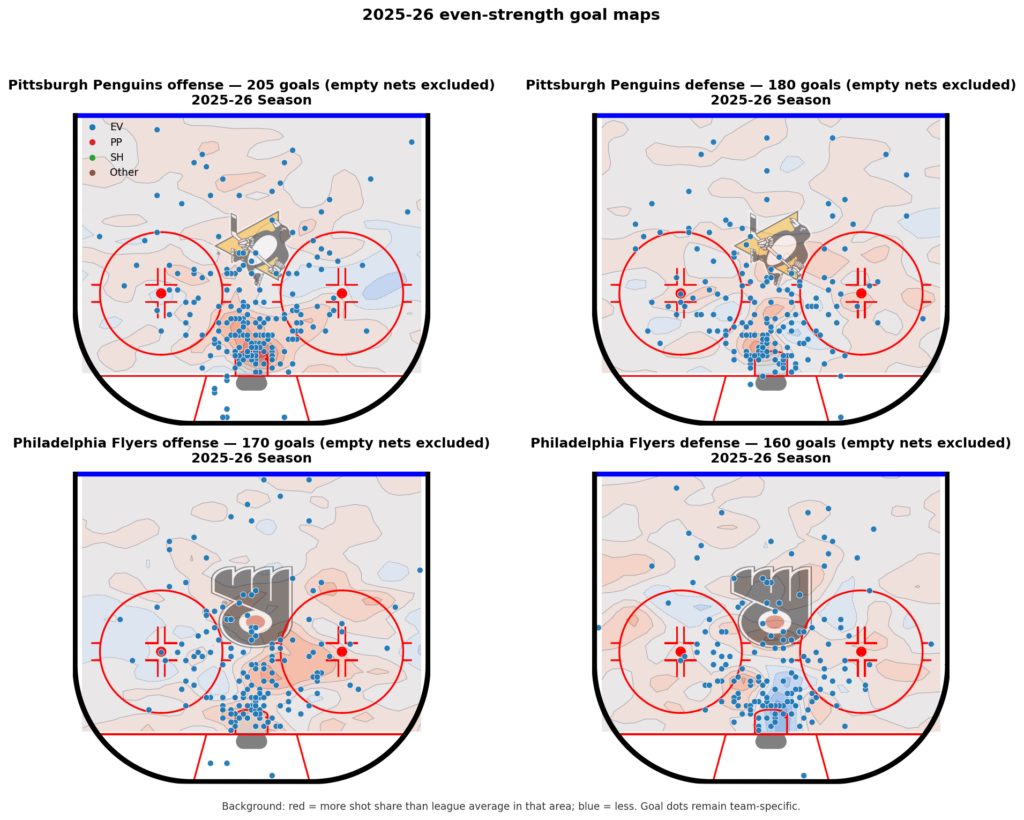
Pittsburgh’s even-strength offense is point-driven and net-front. 38.7% of their shots come from the slot, converting at 8.28% — the strongest slot-conversion rate in this matchup. Only 20.7% come from the perimeter. The Penguins work pucks to Erik Karlsson and Kris Letang at the blue line, fire through traffic, and collect tips and rebounds from Sidney Crosby, Bryan Rust, and Rickard Rakell in front. Karlsson alone has 176 shots on goal from the back end, the Penguins’ top volume shooter from anywhere.
Philadelphia’s shot distribution is similar (36.8% slot, 27.6% high slot, 22.8% perimeter) but with lower slot conversion (7.13%) and much better rebound creation — 14 rebound goals on 178 attempts (7.87%) versus Pittsburgh’s 11 on 213 (5.16%). Owen Tippett (220 shots), Travis Konecny (168), and Matvei Michkov (163) crash the net relentlessly. On the rush, both teams are identical at 12 goals each.
Defensively, the structural gap is obvious. Philadelphia allows 34.3% of shots against from the slot at 6.64%, and gives up just 0.99% on perimeter shots against — effectively a graveyard outside the hash marks. Pittsburgh allows 35.6% slot at 6.99% and is noticeably weaker on the left side of the defensive zone. The Penguins also concede more on the rush (357/15 GA to Philadelphia’s 331/10). Philadelphia’s defense is built on structural suppression. Pittsburgh’s relies on Letang, Parker Wotherspoon, and Karlsson individually bailing out team-level mistakes.
Special Teams and Penalties
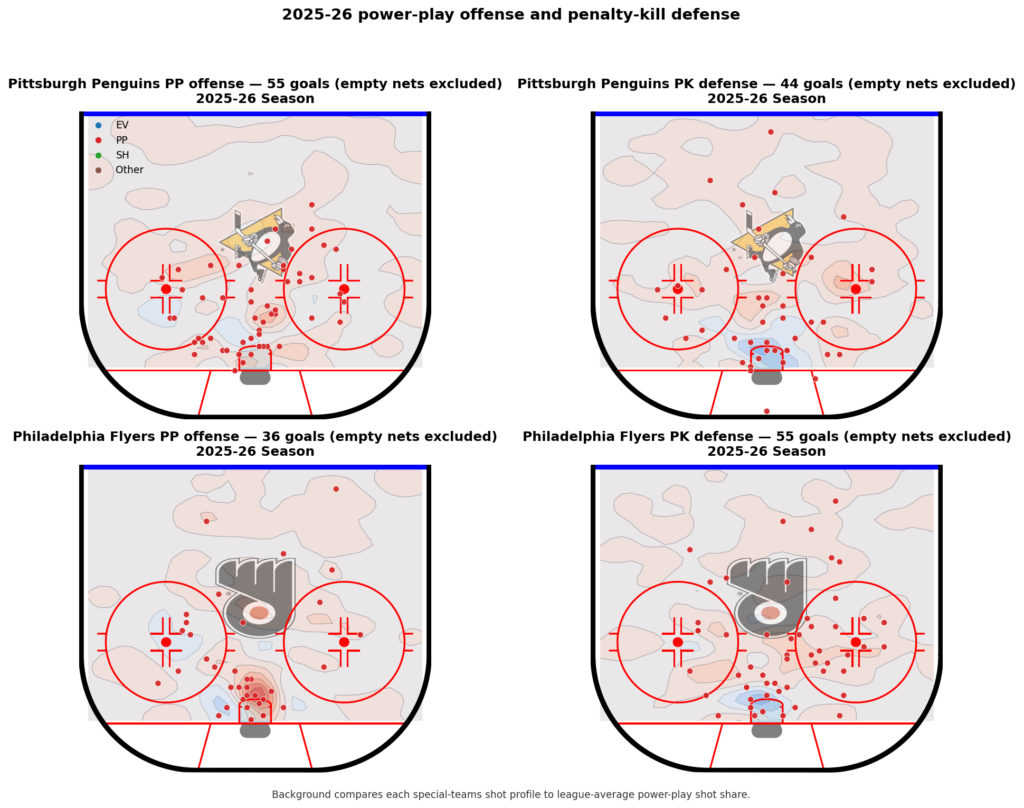
This is Pittsburgh’s biggest single edge, and it isn’t close. The Penguins run a 23.6% power play (55 goals on 233 opportunities, eighth in the NHL, 9.85 goals per 60). Philadelphia’s power play is 15.2% (36 goals on 237 opportunities, 31st in the entire league — only Toronto is worse). That is nearly nine percentage points of conversion on basically the same opportunity count. Over a seven-game series, the gap alone projects to two or three special-teams goals.
Pittsburgh’s top PP shooters are Karlsson (99 attempts from the point), Rust (92 attempts, 8 PP goals, 17.8%), Crosby on the left dot (79, 10, 20.4%), Rakell from the right, and Anthony Mantha in the bumper (20%). Five-headed unit with Karlsson quarterbacking, Crosby distributing from the half wall, three finishers all shooting 15%+. Philadelphia’s PP is Trevor Zegras: 93 attempts, 10 PP goals, 21.7% — the highest PP shooting percentage on either team. After Trevor Zegras, it falls apart: Tippett at 7.5%, Konecny at 6.1%, Jamie Drysdale 1-for-55 as the point-man. That’s the 15.2% conversion in one sentence.
On the kill, Pittsburgh is a tick better (82.3% vs 80.6%) and surrenders fewer goals per 60 (7.04 vs 8.05). The Flyers also took 763 PIM to Pittsburgh’s 634 — 129 extra penalty minutes, or roughly 65 extra minors over the season. Michkov leads all players in the series with 33 penalties taken (30% late in periods — flagged), and Garnet Hathaway had 22 with 41% late-period share. Against Pittsburgh’s 23.6% power play, discipline is the single most important thing the Flyers have to do.
Line Matchups, Size, and Depth
Pittsburgh has 14 skaters over 30 points — 10 forwards and 4 defensemen. Crosby leads at 74 (29G, 45A) in 68 games. Erik Karlsson has 66 (15G, 51A) and 176 shots, eating 23:36 per game, a vintage season quarterbacking the top power play. Rust has 65 with 29 goals. Mantha has been the season’s biggest surprise at 33 goals, 64 points — career-bests at age 31. Malkin adds 61 in 56 games, Rakell 48 (24G), Tommy Novak 42, Chinakhov 36 in only 43 games, Ben Kindel 35, Letang 34, Justin Brazeau 34, and Ryan Shea 35 from the blue line. Production comes from everywhere.
The 5v5 line deployment shows a balance most contenders don’t have. Crosby-Rust-Rakell leads in minutes (365, 51.33% xGF, 16-16). Malkin-Novak-Chinakhov is at 221 minutes, 52.75% xGF, 11 goals for. The Mantha-Brazeau-Kindel third line has 17 GF and only 6 GA in 165 minutes — one of the most lopsided third-line differentials in the league. Acciari-Dewar-Lizotte, the checking unit, has 24 GF and 14 GA in 326 minutes at 54.71% xGF. Pittsburgh’s fourth line scores like most teams’ second lines. On the back end, Karlsson-Wotherspoon has played 1,063 minutes at 5v5 — the most of any pair in the series — at 52.83% xGF. Letang-Shea adds 547 at 49.4% with a 37-21 goal differential.
Philadelphia is more top-heavy. Nine skaters over 30 points: Konecny 68, Zegras 67, Tippett 51, Michkov 51, Christian Dvorak 51, Noah Cates 47, Travis Sanheim 37, Sean Couturier 36, Drysdale 32. After the top six, no Flyers forward has more than 26 points. The top line of Dvorak-Konecny-Zegras has played 289 minutes but sits underwater at 48.9% xGF with a -4 goal differential. Philadelphia traded Bobby Brink to Minnesota at the deadline for David Jiricek, and rookie Porter Martone has stepped in with 10 points in 9 games — the new Dvorak-Konecny-Martone trio is 8 GF, 2 GA in 80 minutes at 56.22% xGF. Small sample but overwhelming rate. On defense, Sanheim-York leads at 642 minutes (47.3% xGF), then Ristolainen-Sanheim (470), York-Drysdale (460). Deeper distribution than Pittsburgh, but nothing with Karlsson-Wotherspoon’s minutes or the Letang pair’s 37-goal output.
Size-wise, Pittsburgh is heavier up front (top-6 averages 201 pounds, bottom-6 202; Philadelphia’s 196 and 193 — no Flyer forward line over 200). But Philadelphia’s defense pairs are bigger: Sanheim-York averages 208 per man, Ristolainen-Sanheim 215, against Karlsson-Wotherspoon’s 187 and Letang-Shea’s 199. Philadelphia is actually the more physical team at 22.9 hits per game to Pittsburgh’s 17.6. Hathaway leads with 252 hits (ninth in the NHL). On blocks, Philadelphia has three D-men over 145 (Sanheim 152, Nick Seeler 149, York 145). In faceoffs, Philadelphia has the edge — Dvorak wins 54.6%, Couturier 70.5% in the defensive zone. Pittsburgh’s Novak is at just 24.1% defensive-zone win rate. Expect the Flyers to use defensive-zone draws to control territory and force Pittsburgh to chase.
Goalies — Where the Series Might Turn
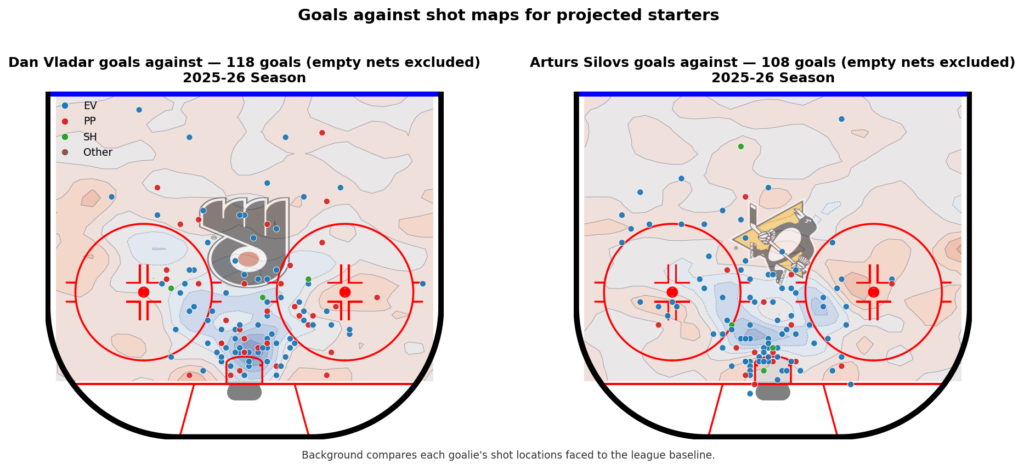
Philadelphia is rolling with Dan Vladar. He’s been the steadier option all season: 74 appearances, 51 starts, .906 SV%, 2.42 GAA, 29 wins. His slot save percentage is .900 — solidly above league average (.890), the most dangerous area on the ice. His perimeter SV% is .981, from 20-40 feet he’s at .942. Vladar reads shots well and is tough to beat through traffic — exactly the profile you want against Pittsburgh’s tip-heavy offense. Samuel Ersson (.870 in 29 starts) is the backup.
Pittsburgh’s situation is messier. Arturs Silovs has 38 starts at .887 / 3.07 and a slot SV% of .869 — 31 points below Vladar’s .900 — with recent form that’s been shaky (.853 over his last 10 starts). Stuart Skinner, acquired from Edmonton in the December swap that sent Tristan Jarry the other way, has 27 starts at .885 and 2.99. Neither is elite. The kicker: Tristan Jarry went 13-of-22 as a Penguin before the trade at a .909 SV% — the highest of any goalie on either team. He’s now an Oiler, and the Penguins spent the back half of the season figuring out if the guy they traded away was the goalie they needed. Silovs starts Game 1 on workload. If he wobbles, Skinner is the fallback.
In a series where Philadelphia concentrates offense in the slot and Pittsburgh concentrates its own from the point with tips, Vladar’s slot and traffic numbers are the single biggest positional advantage on the board.
Recent Form and Head-to-Head
Since January 1, Pittsburgh’s stars have been exceptional. Karlsson leads at 38 points in 37 games (1.03 PPG). Mantha has 37 in 43, Chinakhov 36 in 43, Rakell 35 with 20 goals in 42, Crosby 34 in 30 (1.13), Malkin 32 in 30 (1.07), Rust 31 in 36. Seven Penguins averaging 0.85 or better. Post-Olympic, Karlsson ranks 10th in the entire NHL in points (31 in 24 games) and Rakell ranks 11th in goals (14). The skilled core has been producing at playoff pace for months.
But Philadelphia has been the better overall team since the Olympic break: 18-7-1, a .712 points percentage, top-five in the NHL during that window. Post-Olympic xGF/60 has climbed and xGA/60 has dropped. Pittsburgh’s numbers have done the opposite. Michkov is on a surge — +0.504 PPG delta over the last 15 games versus his full-season rate (17 points in 15 games). Ristolainen and Cates are trending up. On the Penguins side, Karlsson and Rakell stay hot; Novak, Kindel, Brazeau, and Dewar have cooled.
The four head-to-head games tell the series arc in miniature.
October 28 in Philadelphia — Flyers 3, Penguins 2 (SO). Brink had a goal and an assist before he got traded. Konecny scored. Crosby and Brazeau answered. Philadelphia took it in the skills competition.
December 1 in Philadelphia — Penguins 5, Flyers 1. Pittsburgh’s biggest win of the series, in the Flyers’ building. Rust three points, Crosby twice, Malkin and Karlsson two assists each. Pittsburgh went 3-for-4 on the power play and killed all seven Philadelphia advantages.
January 15 in Pittsburgh — Penguins 6, Flyers 3. Another rout. Crosby multi-point, Novak and Malkin two assists each. Pittsburgh went 3-for-4 on the power play again. Philadelphia went 0-for-4.
March 7 in Pittsburgh — Flyers 4, Penguins 3 (SO). The tightest. Rakell and Karlsson scored for Pittsburgh, Chinakhov added two assists. Tippett scored for Philadelphia. Pittsburgh went 1-for-6 on the PP — regression — and the Flyers stole it in the shootout.
Across all four H2H games, Pittsburgh’s power play went 7-for-18 (38.9%), well above the 23.6% season rate. Philadelphia went 1-for-15 (6.7%), less than half their season rate. If the Flyers’ PP stays cold and the Penguins’ stays hot, Pittsburgh wins easily. When things equalize in regulation — like March 7 — Philadelphia is better in the tight ones and in extra time.
Bottom Line
The case for Pittsburgh: top-three NHL offense, eighth-ranked power play (55 goals to Philadelphia’s 36), a Crosby/Karlsson/Mantha/Rust/Rakell top-five scoring at playoff pace since January, a third line with a plus-11 at 5v5, and four 30-point defensemen including Karlsson’s vintage 66-point season. The case for Philadelphia: ninth-ranked goals-against, top-10 scored-first conversion, elite perimeter-suppression defense, Vladar’s .900 slot save percentage, an 18-7-1 post-Olympic record, a 10-4 shootout mark that already cost Pittsburgh twice in the season series, and the new Dvorak-Konecny-Martone line at 56% xGF.
Pittsburgh rests on star power and special teams. Philadelphia rests on structure, discipline, and the single biggest edge on the board: goaltending. Vladar has a 31-point slot-SV% advantage over Silovs. Philadelphia’s power play won’t break out unless Zegras goes on a tear, but if the Flyers stay out of the box, the Penguins’ PP won’t matter. And if games are tight in the third, the shootout data says Philadelphia gets the benefit of the doubt.
If Pittsburgh’s power play replicates its 38.9% head-to-head conversion rate, it’s Pittsburgh in five. If Philadelphia plays disciplined, forces two or three overtime games, and Vladar steals one, it’s Philadelphia in seven. Two teams tied at 98 points for a reason — expect it to go long.
All numbers from my April 14 data pull, covering 82 games per team. Pittsburgh: 41-25-16, 98 points, 293 GF / 268 GA, +25. Philadelphia: 43-27-12, 98 points, 250 GF / 243 GA, +7. PIT PP%: 23.6 (8th). PHI PP%: 15.2 (31st). PHI post-Olympic: 18-7-1. PIT post-Olympic: 12-10-4. Karlsson: 66 points, 176 shots, 10th in NHL post-Olympic points. Crosby: 74. Mantha: 33 goals. Rakell: 20 goals since Jan 1. Konecny: 68. Zegras: 67. Vladar: .906 / 2.42, .900 slot SV%. Silovs: .887 / 3.07. Jarry (traded to EDM in Dec): .909 in 22 PIT starts. Season series: 2-2, with both Flyers wins in the shootout.
Related Posts

Starting Goalies














Top Skater Views
| Players | Team | |
|---|---|---|
| ADAM JIRICEK |
 STL STL | |
| BEN KINDEL |
 PIT PIT | |
| COLE PERFETTI |
 WPG WPG | |
| JADEN SCHWARTZ |
 COL COL | |
| MATVEI MICHKOV |
 PHI PHI
| |
Top Goalie Profile Views
| Players | Team | |
|---|---|---|
| SERGEI MURASHOV |
PIT | |
| DYLAN GARAND |
 NYR NYR | |
| JOEL HOFER |
STL | |
| JUUSE SAROS |
 NSH NSH | |
| DAN VLADAR |
PHI
| |
LINE COMBOS
| Frequency |
PHI Players
| |
|---|---|---|
| 18.3 | OWEN TIPPETT MATVEI MICHKOV SEAN COUTURIER | |
| 16.4 | GARRETT WILSON MICHAEL BUNTING NOEL ACCIARI | |
| 12.8 | TREVOR ZEGRAS TYSON FOERSTER CHRISTIAN DVORAK | |
DobberHockey Podcasts

Keeping Karlsson: Matchup Maximizer 2026/27 Week 3
Elan takes a look at the schedule for the upcoming weeks of NHL action and recommends players with good schedules that you should consider streaming in to win your head to head matchups.
Keeping Karlsson: Short Shifts – Sharks Looked Like Celebweenies
Elan recaps the major injuries, outjuries, game results and changed line combos that we’ve seen since Sunday’s mega-show.
Keeping Karlsson: Cole, There’s No Time!
Elan and Brian cover all the action from the first week of the NHL season, and identify our earliest must-adds, can-drops, sell highs and buy lows in your fantasy hockey leagues.
Keeping Karlsson: Matchup Maximizer 2026/27 Week 2
Elan takes a look at the schedule for the upcoming weeks of NHL action and recommends players with good schedules that you should consider streaming in to win your head to head matchups.

Fantasy Hockey Life: Tidy Takes Part 1
TiDy Admiral Ryan Downey and Victor Nuno break down recent trades in the FHL Tiered Dynasty’s top division, the Lord Stanley division. Tune in to consider trades between some of the best dynasty sharks we know, including patron polls on the trades and Victor’s analysis. Have a listen! Our show is part of the Dobber […]