

Analytics Advantage: Analyzing Depth Charts and Which Players Gain or Lose Ice Time
Stas Pupkov
2026-08-14
Every August the depth-chart sites publish projected lines for all 32 teams, and every August fantasy players draft off them. I have never seen anyone check whether those charts come true, so I did: six years of archived August depth charts, 2019 through 2024, 5,947 player-slots pulled from the Wayback Machine and scored against what actually happened. A chart that promises a player a big minute gain is right 46% of the time, against a base rate of 24%. A promised loss lands 42% of the time against 26%. The chart is a useful bet and a beatable one, and by the end of this piece you will have the thing that beats it, plus three boards of 2026-27 names it produces.
The July 2019 chart is a good place to start. It listed Jean-Gabriel Pageau as Ottawa’s fourth-line center. He played 19 minutes a game that season.
Three definitions
Minutes in the NHL come in seven jobs plus special teams, and the whole piece runs on that ladder, so here are the terms once.
The job ladder is four forward lines, three defense pairs, and the four special team units. A first-line forward averages 16.5 even-strength minutes a game, the fourth line 11.2; the pairs run 20.0, 17.7, 15.3. PP1 adds 2.2 minutes, PP2 adds 1.5, PK1 adds 1.8, PK2 adds 1.4. Knowing a player’s slot explains 90% of his time on ice, with a spread of 1.2 minutes inside a slot, which is why line assignments matter more than any skill argument when you are projecting deployment.
A chart call is the minute change implied when a depth chart’s slot for a player differs from the job, he actually held last season. Buffalo listing last year’s 17-minute center on the fourth line is a chart call of roughly minus six.
The projections, which arrives in the second half, are three numbers per player and no scouting; a weighted three-season rate for each component (even strength, power play, penalty kill), an aging step, and a pull toward the player’s own established norm. It was fit on 2007 through 2018 and tested on everything after, so none of the results below are graded on their own training data.
The ladder and where it moves
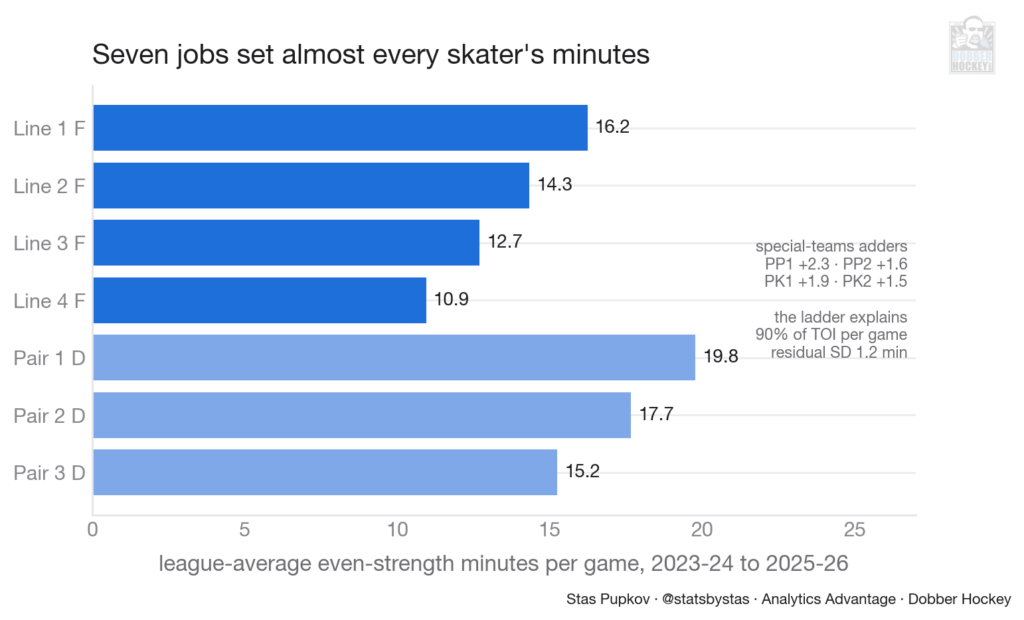
Figure 1.
Figure 1 is the ladder itself. The useful surprise is in Figure 2, which tracks how players move between rungs year over year. First-line forwards keep their line 75% of the time and fourth-liners 73%, while line 2 holds only 48% and line 3 only 39%. The top of a lineup is furniture and so is the bottom; nearly all the minute movement that fantasy owners care about happens in the middle six and on the second pair. If you are going to spend scarce August attention anywhere, spend it there.
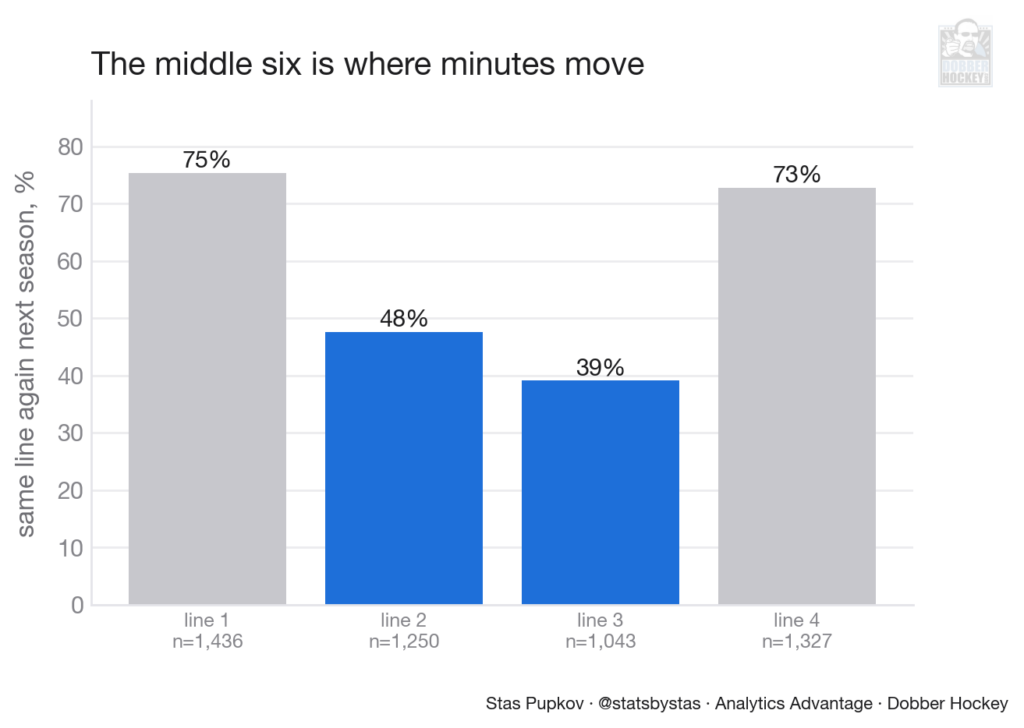
Figure 2.
Where vacated minutes go
Here are two important findings from 19 seasons of roster turnover, and they pull in opposite directions.
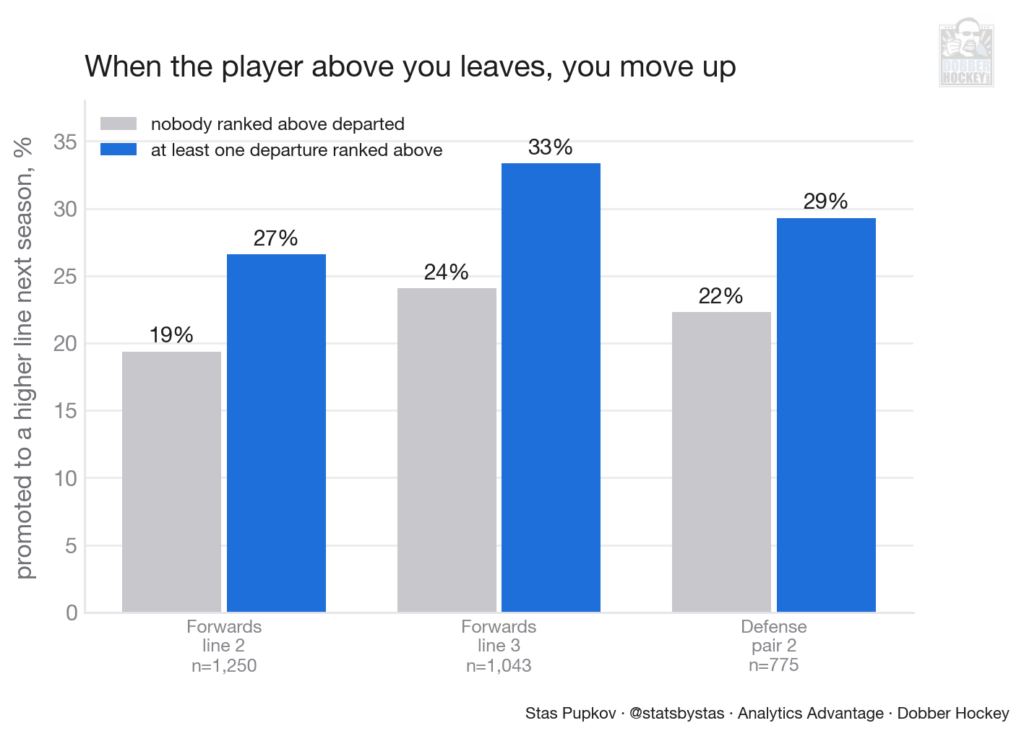
Figure 3.
The first finding is that inheritance is real. A second-line forward whose above-ranked teammate leaves in the offseason gets promoted to a higher line 27% of the time, against 19% when nobody above him departs. For third liners the split is 33% against 24%, for second-pair defensemen 29% against 22%, and all three gaps survive a cluster bootstrap by player. When a job opens above you, your odds of moving up rise by 7 to 9 points.
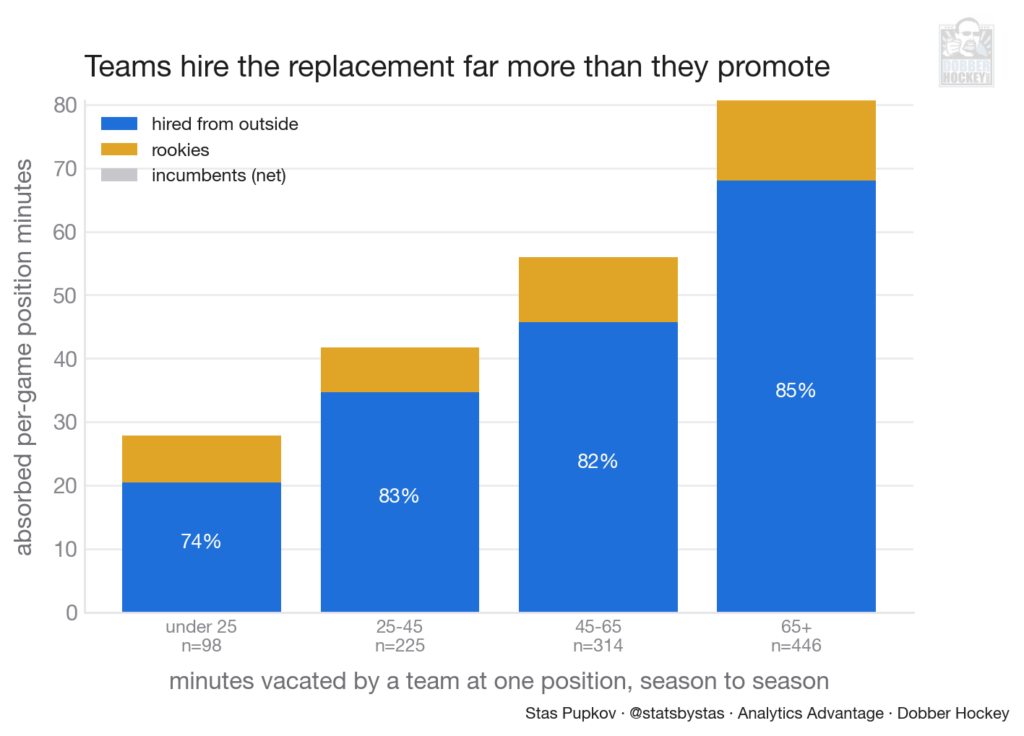
Figure 4.
The second finding is that inheritance is the minority outcome. Across 18 season-to-season transitions, 83% of vacated position minutes were absorbed by players from outside the organization and 17% by rookies, while incumbents in aggregate gained roughly nothing. Teams hire the replacement far more often than they promote one. Both findings fit together: the individual bump is real but modest, because most open minutes get filled by a July signing before camp ever starts. The August roster already contains most of the answer, which is why the sites publish those charts in the first place, and why grading them is worth a section.
Grading six years of August charts
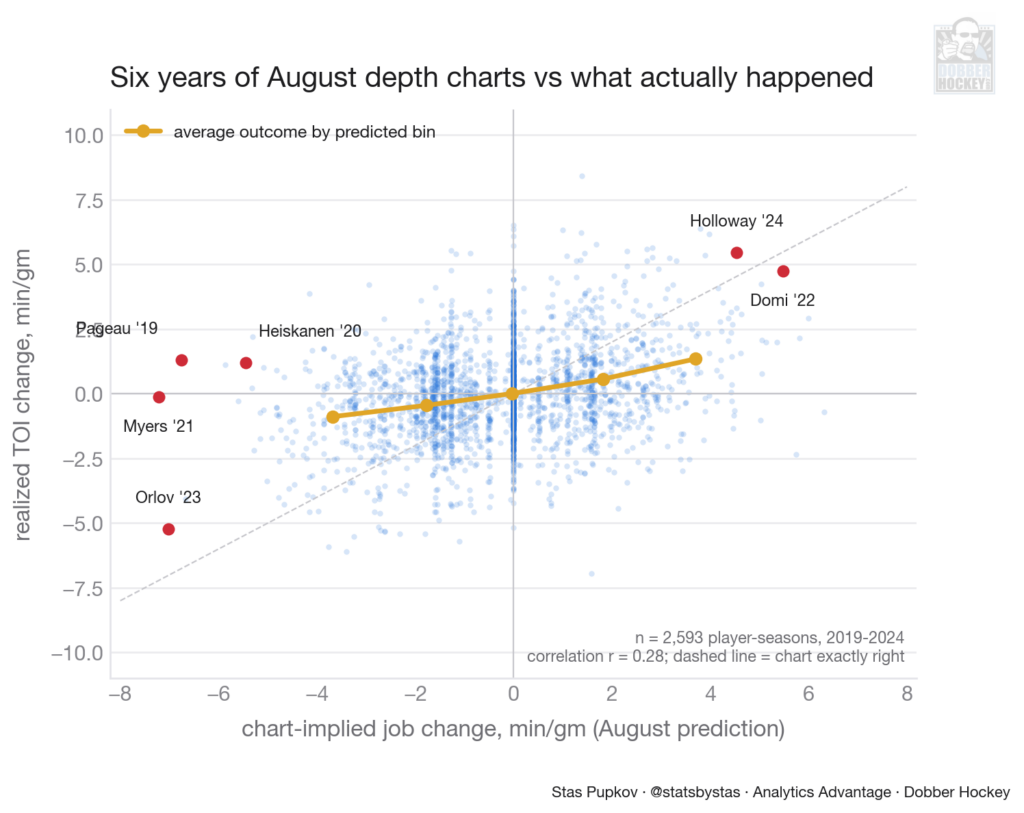
Figure 5.
Figure 5 is every scored chart call from 2019 through 2024, 2,593 player-years, with the chart’s implied minute change on one axis and the realized change on the other. The gold line, the average outcome in each prediction bin, slopes the right way at every step, so the charts carry real information. It also sits far below the diagonal: a chart call of four minutes moves the average player about one. Direction yes, magnitude no.
The specifics are humbling for anyone who drafts off these pages. The chart’s exact line placement matched the player’s realized season line 54% of the time, though it was within one line 92% of the time. In 16.5% of team-years the chart’s listed first line was out-iced by its listed second line, so roughly one team in six publishes decorative line order. Dallas Stars readers who saw Justin Hryckowian at first-line left wing this summer, above the Robertson and Hintz line, already know the failure mode.
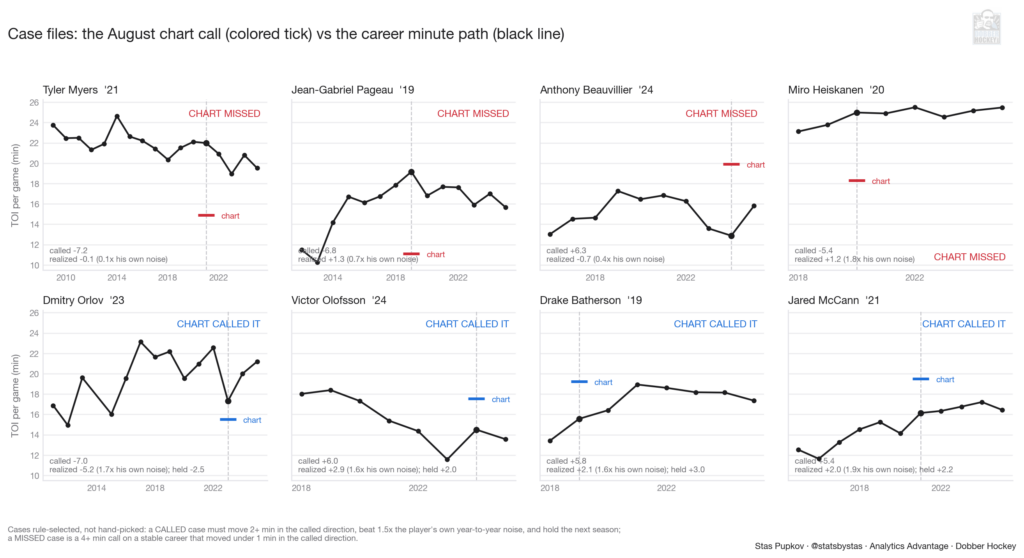
Figure 6.
Figure 6 puts names on both tails, and the cases picked themselves: a call counts as landed only if the player moved at least two minutes in the called direction, beat one and a half times his own year-to-year noise, and held the move the following season, while a miss is a four-minute call on a stable career that moved less than one. The misses are the August bets that reality ignored. Tyler Myers was called down 7.2 minutes in 2021 and lost 0.1. Pageau was called down 6.8 in 2019 and gained 1.3. Miro Heiskanen was listed as a second-pair defenseman in 2020 while running a 25-minute career. The landed calls are just as concrete: Dmitry Orlov, called down 7.0 in 2023, lost 5.2 and stayed down; Victor Olofsson, called up 6.0 in 2024, gained 2.9; Drake Batherson and Jared McCann rode their 2019 and 2021 calls up and kept the minutes. Held to the noise-adjusted standard, chart calls land 26% of the time against a 13% directional base, which is the honest version of the claim that the chart knows something.
The projection that beats it
The Marcel-style projection I described in the definitions was scored on the same players over the same six years, head-to-head. It wins on every metric: correlation with realized minute changes of 0.365 against the chart’s 0.279, an average error of 1.28 minutes against 1.67, and, on the confident calls of two minutes or more, a 60% hit rate on 115 calls against the chart’s 43% on 597. The model makes far fewer big calls, and the ones it makes are worth acting on. Blending the two sources added nothing over the model alone, so the rest of this piece runs on the model and uses the depth charts for nothing except knowing who is on which roster.
The aging curve inside it is worth quoting on its own, because it is the cleanest deployment fact I know. A 19-year-old NHL regular gains 1.2 minutes a game per season on average. The curve crosses zero at 26. A 34-year-old gives back about 0.9 a year and a 40-year-old 1.7. Minutes peak years before points folklore says players do, and the decline is a ramp, whereas most owners price it as a cliff that arrives at 35.
One paragraph of honesty before the boards. The model prices gravity: age plus regression toward a player’s own multi-year norm. It cannot see a coaching change, an injury, or a camp battle, and when I tried to feed it vacated minutes as a feature, the coefficient came back near zero because the three-season base already absorbs most roster context. Treat the boards as the baseline the season bends around, and treat the middle-six churn from Figure 2 as your reminder of where the bending happens.
The boards
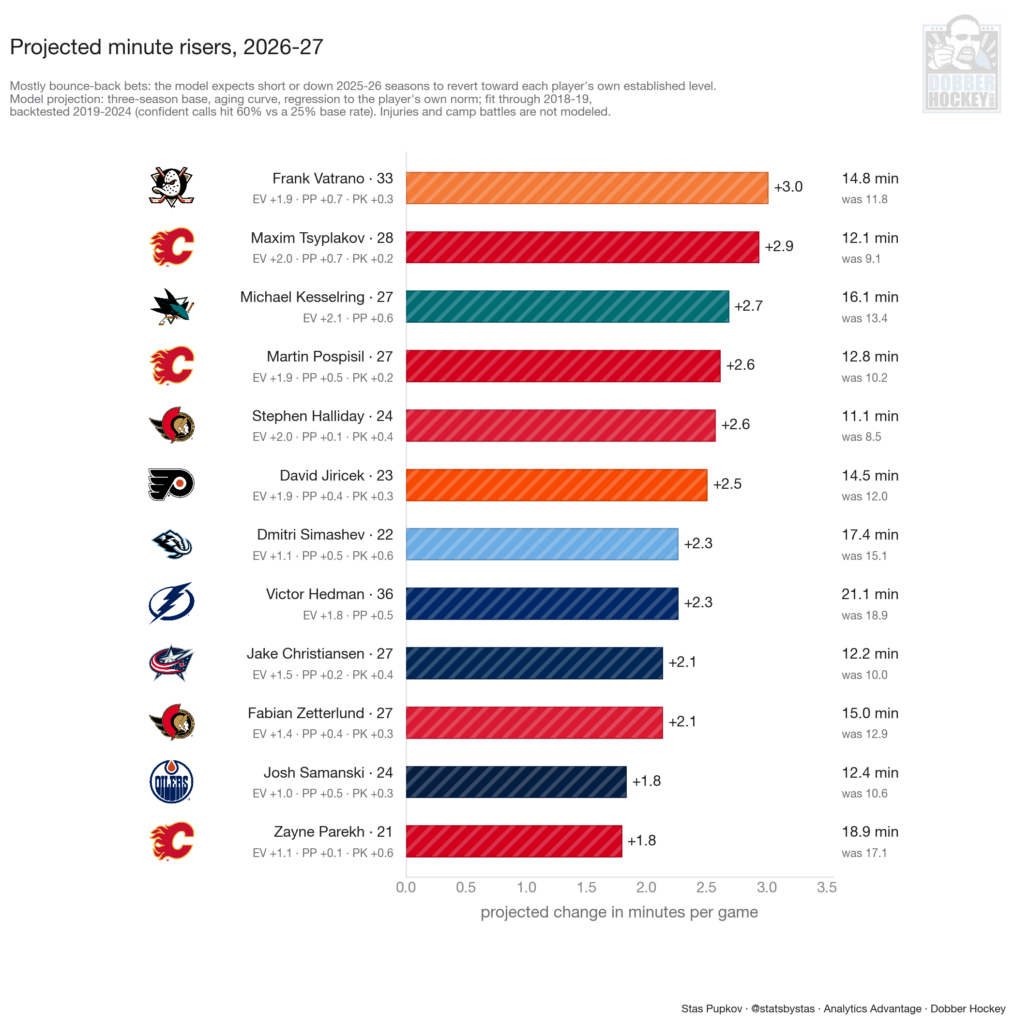
Figure 7.
The risers are mostly bounce-back bets, which is what a gravity model produces on purpose. Frank Vatrano projects to gain 3.0 minutes, back to 14.8 a game, because his 50-game 2025-26 sits well below three seasons of 17-minute usage. Maxim Tsyplakov (+2.9) and Martin Pospisil (+2.6) are the same shape with the Calgary Flames, and Michael Kesselring (+2.7) carries the defense version for the San Jose Sharks. Victor Hedman at +2.3 is the veteran case: a 33-game season dragged his rate down, and the model expects the 21-minute norm to reassert even against a 36-year-old’s aging step. None of these are skill takes. They are statements that one bad or short season is weaker evidence than the three seasons before it.
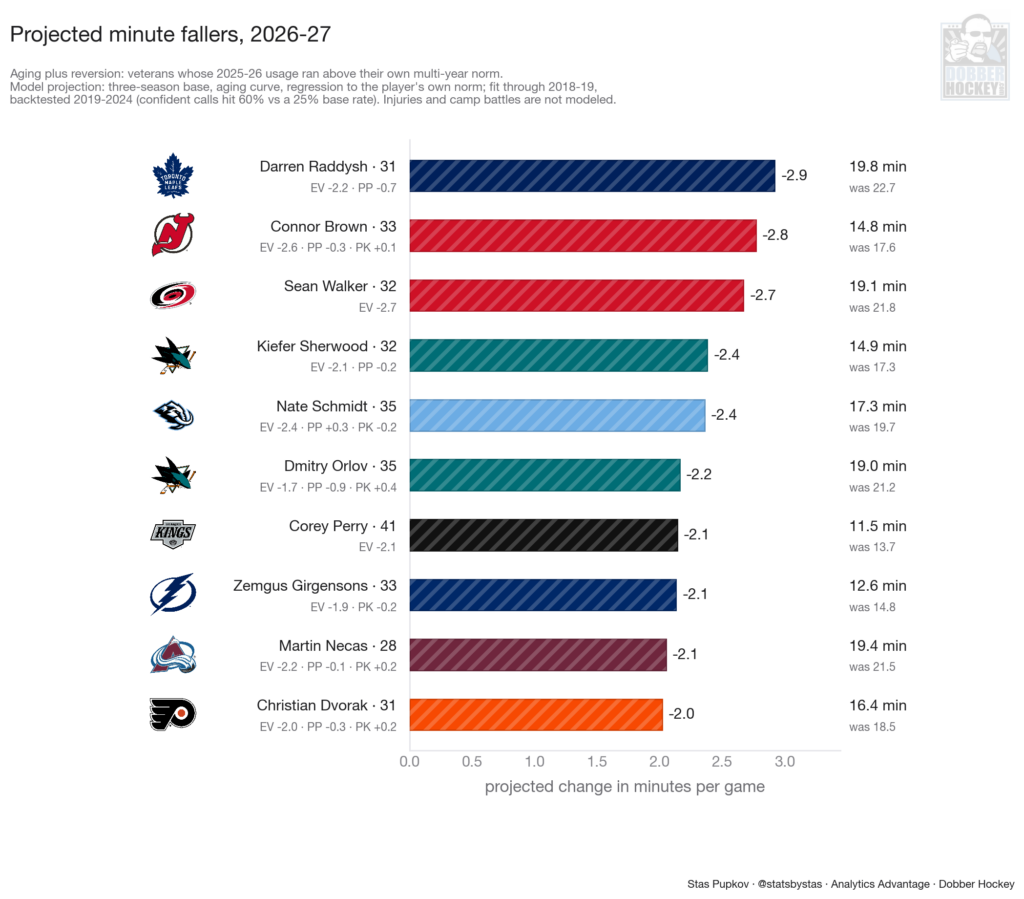
Figure 8.
The fallers are age plus reversion. Darren Raddysh projects to give back 2.9 minutes after a 22.7-minute season on a career built around 17, and the market will pay for the 22.7. Connor Brown (-2.8), Sean Walker (-2.7), and Nate Schmidt (-2.4) are veterans whose 2025-26 usage ran above their own norms. Martin Necas at -2.1 is the one under-30 name in the top ten, there because 21.5 minutes in Colorado sits three above his multi-year level; he is the board’s most arguable call and the first one I would override with roster context.
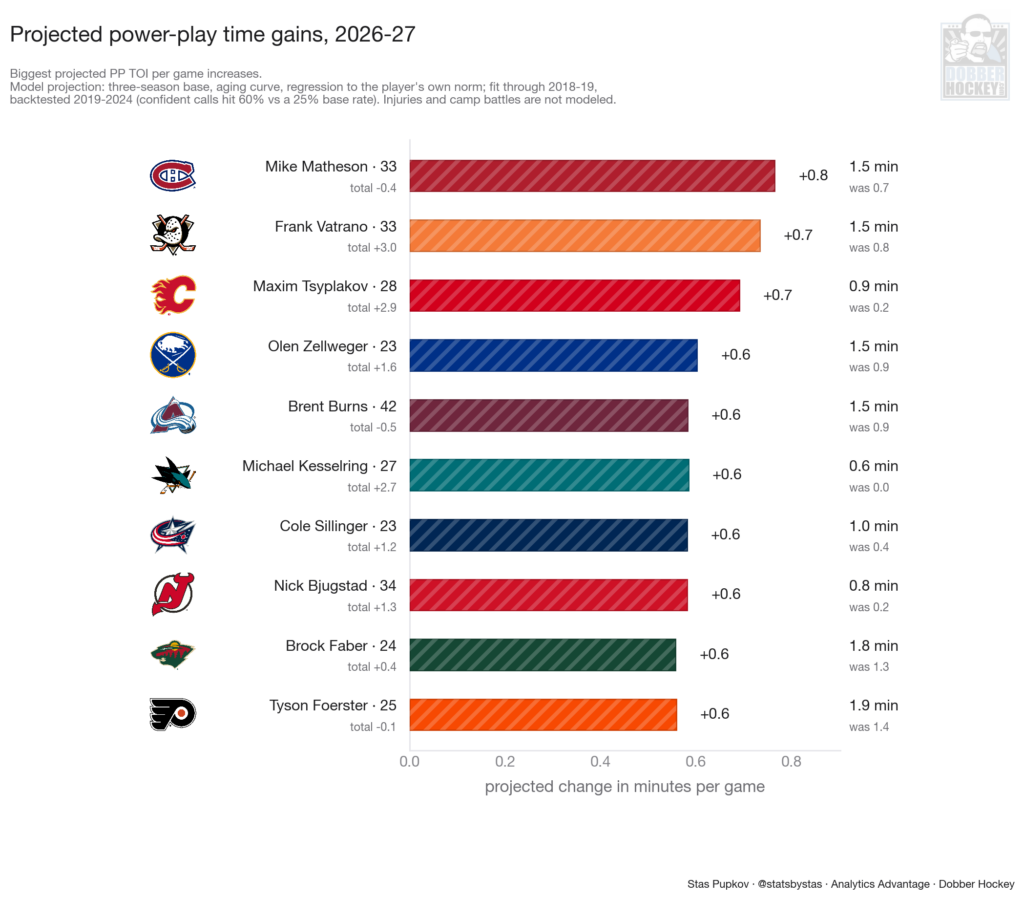
Figure 9.
For points leagues, the power-play board matters more than the total. Mike Matheson projects the largest PP gain at +0.8 minutes, with Vatrano at +0.7 and Olen Zellweger, Brock Faber, and Tyson Foerster in the +0.6 band. Faber is the name I would flag: a 24-year-old already at 1.3 PP minutes whose projection climbs toward 1.8, on a Minnesota unit worth being on.
Rookies and returning players
The model needs NHL history, so this fall’s debuts get an empirical prior instead, built from all 783 debuts of 20 or more games since 2008-09. A top five pick forward debuts at 15.6 minutes a game on average, with the middle half between 13.7 and 17.6 and 1.9 of it on the power play. A top 15 forward debuts at 13.7, a later-round pick at 11.7, an undrafted import at 11.8. Top five defensemen debut at 19.9. Applied to the names on current rosters: Gavin McKenna and Ivar Stenberg carry the top five cell, so history says 15 to 16 minutes with real power-play time from opening night, while Roman Kantserov and the KHL imports carry the 11.7-to-11.8 cells regardless of how loud their camps get. The prior corrects hype in both directions.
Returning veterans project off their older seasons: Aleksander Barkov at 19.1 minutes with 2.5 on the power play, Chris Tanev at 18.3. The young returns with only short NHL stints behind them, Cole Hutson and Carter Yakemchuk among them, come out of the model as sketches with wide error bars, and I would draft them on role news, not on these numbers.
The playbook
- Read August depth charts for direction only. A big implied move lands at less than half its promised size on average, and one team in six publishes decorative line order.
- Spend your attention on the middle six and the second pair, where line 2 holds year over year only 48% of the time and line 3 39%, while the top and bottom of the lineup barely move.
- When a player above your target departs, promotion odds rise by 7-9 points. That is a tiebreaker between two similar targets, not a thesis.
- Trust the bounce-back board where the price is depressed. The model’s confident calls hit 60% across six out-of-sample seasons.
- Fade the fallers board at cost. The market pays for last season’s 22-minute usage, and the model expects those seasons to shrink by two to three minutes.
- Re-check everything at camp and again at Game 10. My July piece on breakout performances showed new minutes are visible inside a player’s first ten games, and every roster input here is an August snapshot.
Related Posts
Starting Goalies



Top Skater Views
 CHI
CHI N.J
N.J COL
COLTop Goalie Profile Views
 T.B
T.B MTL
MTL STL
STL PIT
PIT

LINE COMBOS
| Frequency |
 S.J Players S.J Players
| |
|---|---|---|
| 23.5 | WILL SMITH MASON MARCHMENT MACKLIN CELEBRINI | |
| 21.4 | ALEXANDER WENNBERG IVAR STENBERG COLLIN GRAF | |
| 18.3 | KIEFER SHERWOOD ZACK OSTAPCHUK BARCLAY GOODROW | |
DobberHockey Podcasts

Keeping Karlsson: Shabanov Ranks
Elan and Brian fly through the final preseason lines for every NHL team ahead of opening night, and share their guys to watch– or look away from– in your fantasy hockey leagues.

Fantasy Hockey Life: Western Conference Catchup and Mustard
Jesse and Victor are here to Catch Up on everything in the Western Conference that transpired ofter our team previews. We also have our annual spicy mustard competition – two hot takes per team. Our show is part of the Dobber Podcast Network and sponsored by Fantrax.com. Email [email protected] and ask to join our free […]
Keeping Karlsson: Matchup Maximizer 2026/27 Week 1
Elan takes a look at the schedule for the upcoming weeks of NHL action and recommends players with good schedules that you should consider streaming in to win your head to head matchups.
Fantasy Hockey Life: Dallas Stars with Taylor Newby
Taylor Newby joins the program to discuss the Dallas Stars.
Keeping Karlsson: KKUPFL Tier 1 Draft Roundtable
Elan and Brian are joined by several KKUPFL Tier 1 managers, to bring you inside their draft table decisions and thought processes in building the teams competing in the top division of the world’s best fantasy hockey league.